Have you looked at the latest Twitter stats for 2025?
If not, you’re already a few steps behind.
Twitter may have changed its name, but it remains a major player in the marketing world.
With over 611 million monthly active users and growing, the platform is rapidly climbing back up the ranks it once slipped from.
Marketers are paying attention for good reason; users aren’t just scrolling; they’re discovering brands, clicking links, and making purchases.
But here’s the catch: Twitter in 2025 doesn’t follow the old rules.
The algorithm has evolved, and what drives engagement today looks very different.
If you’re still guessing or relying on outdated tactics, you’re missing real opportunities.
This post breaks down the most important Twitter stats of 2025, the ones that actually matter if you want to grow, convert, and stay ahead of the competition.
And if you want an immediate boost to your X strategy, pairing these insights with Social Champ’s Twitter scheduler will give you a real edge.

Ready to Rule Your Twitter Feed?
Take control of your posting schedule today with Social Champ’s smart automation tools.
Short Summary
- Twitter (X) has over 611 million active users in 2025, making it a vital platform for marketers.
- The core audience is mainly adults aged 25-34, with content tailored to their interests performing best.
- Video content drives higher engagement, especially short-form clips optimized for mobile viewing.
- Features like Spaces, Communities, and X Premium offer new ways to connect and engage audiences.
- Compared to competitors, Twitter (X) holds its position in real-time conversations and niche community building.
Twitter (X) Stats 2025: At a Glance (User, Growth & Engagement)
So, is Twitter (X) still worth your time in 2025?
The short answer: absolutely!
The data proves it.
While the platform has gone through major shifts, one thing hasn’t changed: it remains a go-to for real-time conversations, trend discovery, and brand engagement.
The user base is active, the content is fast-moving, and the opportunities to connect with audiences in the moment are still unmatched.
Many brands, influencers, celebrities, and public figures alike are using X to share their opinion, recent news, and connect with their audience.

What’s even more telling is who’s driving this activity.
And while daily activity remains strong, posting behavior has shifted; brands are tweeting less frequently but with more intentional, engagement-focused content.
Let’s take a look at each of these stats and more in detail.
Featured Article: Twitter Trends: Why Marketers Should Pay Attention & How to Capitalize in 2025
Twitter (X) User Demographics: Who’s Using X in 2025 and How?
Understanding who’s using X in 2025 and how they engage is essential for crafting effective marketing strategies.
The platform attracts a diverse audience, with distinct preferences and behaviors shaping the way content is consumed and shared.
From younger users’ driving trends to influential voices shaping conversations, knowing the demographic landscape helps marketers tailor their approach for maximum impact.
User Growth & Reach
- Daily Active Users: Approximately 245 million users engage with the platform daily.
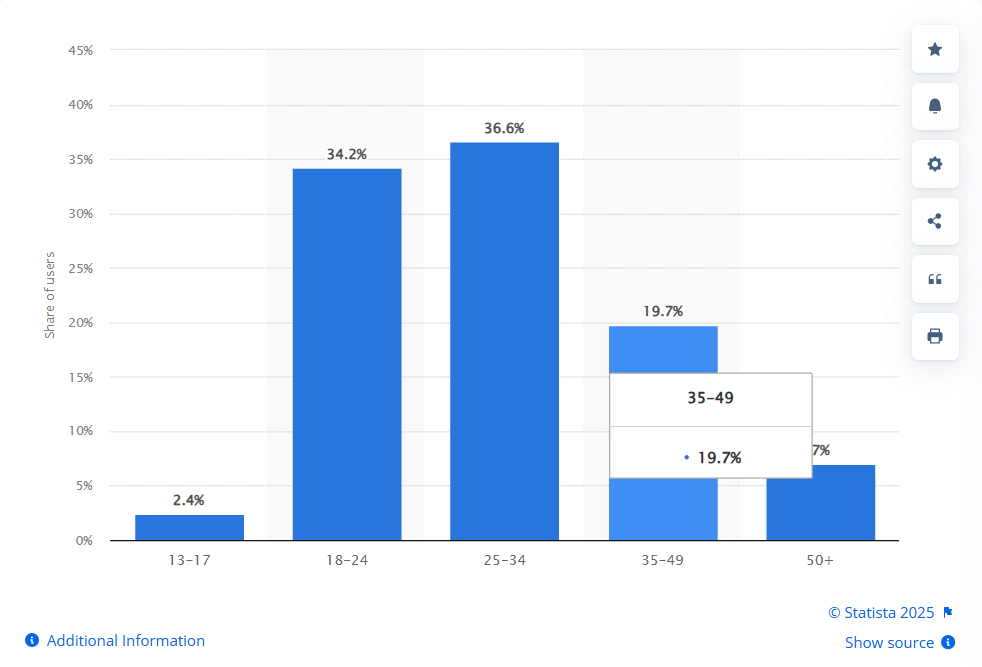
Age
- The majority, 36%, are between 25-34 years old.
- 34% are between 18-24 year olds.
- 7% of users are 50%
- The least involved age group is 13-17 year olds, comprising only 2.5%

(Source: Statista)
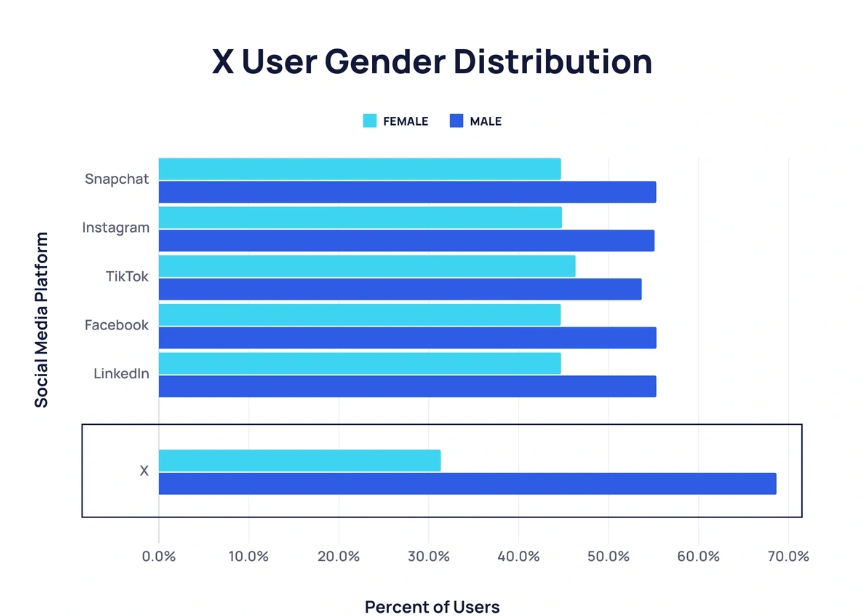
Gender
- There’s a male-to-female ratio of just over 2:1.
- The female user demographic of X is 31.34%.
- Whereas, the male users show 68.66%.

(Source: Exploding Topics)
X Follower Stats by Device
In 2025, X (formerly Twitter) continues to be predominantly accessed via mobile devices, with approximately 75.6% of users engaging through smartphones and tablets.
Despite the mobile dominance, desktop usage remains significant, accounting for about 24.4% of visits.
This dual-device engagement highlights the need for marketers to ensure their content is responsive and effective across both platforms.

(Source: Semrush)
Twitter (X) Marketing & Ad Stats: What Brands Need to Know
With the platform’s evolving algorithms and user behavior, brands demand data-driven insights to optimize their campaigns and maximize ROI.
PM), click-through rate (CTR), and overall marketing effectiveness are crucial for anyone looking to invest wisely in X in 2025.
Understanding key metrics like ad reach, cost per mile, and CTR.
Let’s break down the numbers marketers need to make smarter decisions and stay competitive in this fast-paced digital arena.
Ad Reach
X’s advertising ecosystem reaches a broad and engaged audience, offering brands the opportunity to scale their visibility efficiently.
- Monthly Ad Reach: In 2025, X’s ads reached over 586 million users in January.
- Growth Rate: This growth translates to approximately 13 new accounts every second, highlighting the platform’s expanding user base.
- User Engagement: Users spend an average of 30.9 minutes daily on X, with a 12.5% year-over-year increase in time spent, indicating growing user engagement.
CPM
Cost efficiency remains a key factor in platform selection.
X’s advertising CPMs vary by industry but generally present a competitive option.
- Average CPM: Average Cost per 1,000 impressions is $6.50.
- Industry Variations: CPM rates can vary significantly across industries, with sectors like retail and entertainment often experiencing lower CPMs, while finance and tech tend to see higher costs due to competitive bidding.
- Vertical Video Ads: Early adopters of vertical video ads have experienced 14% lower CPMs
CTR
CTR is a vital indicator of ad relevance and engagement quality.
- Average CTR: The average CTR for X ads is 0.86%, which is higher than the benchmarks for LinkedIn and YouTube ads.
- Video Ads: Video ads generally outperform static images, showing higher CTRs due to their dynamic and engaging nature.
- Video Ads Performance: Video ads on X have shown to boost sales effectiveness by 20%, indicating a higher engagement rate compared to other ad formats.
Engagement Trends
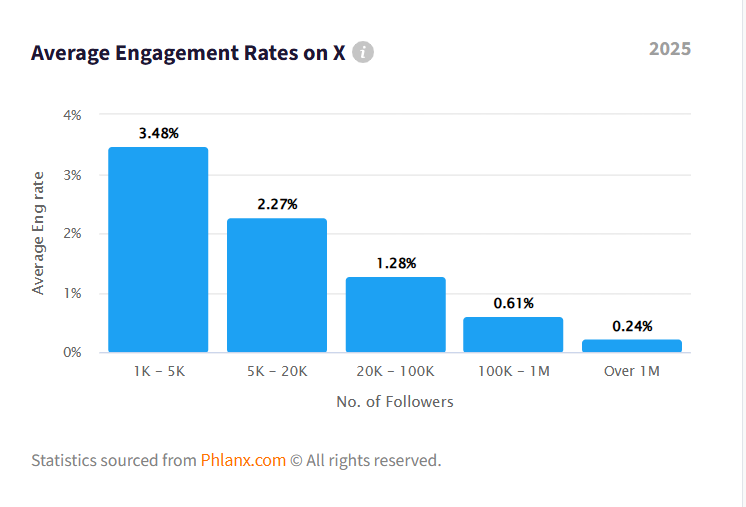
- Engagement Rate: The average engagement rate on X for 2025 is 1.57%.

(Source: Phlanx)
- Video Tweets: Receive 10 times more engagement than text-only posts.
- Retweets: Account for 50% of total platform interactions.
- Posting Frequency: The median tweet frequency dropped to 2.16 tweets per week, while the media industry tweets 23 times the median.
- Video Views: Video views on X are growing at an average rate of 35% year by year, according to X Business.
Market ROI
Twitter Blue integrations (paid tier) may offer improved ad visibility, though adoption remains niche. Moreover, the best results are seen with event-based promotions, product drops, and live-tweet campaigns.
- Overall ROI: X delivers an average ROI of $2.70 for every $1 spent, outperforming other platforms by 40%.
- Product-Focused Campaigns: Campaigns focused on product promotions have shown a short-term sales ROI of nearly $2, compared to about $0.30 for brand-only campaigns.

Make Every Tweet Count
Optimize your Twitter strategy with Social Champ’s data-driven scheduling and analytics.
Twitter (X) vs Competitors: How X Stacks up in 2025
Every marketer is asking the same question: “Is X still worth my time compared to other platforms?”
The answer depends on your audience, content style, and campaign goals—but having a side-by-side view helps make that decision easier.
In 2025, X continues to stand out for real-time engagement and cultural relevance.
But how does it measure up to platforms like Instagram, TikTok, and LinkedIn in terms of performance metrics?
Below is a table comparing the key factors—user base, engagement, ad efficiency, and demographic reach, so you can see where X leads and where others take the edge.
| Platform | Total Users | Engagement Rate (Avg) | Ad CTR Rate (Avg) | Notable Demographics
(According to Statista) |
| X/Twitter | 611 Million | 1.57%. | 0.86%, | Top Age Group: 25–34 years
Top Gender: Male (63.7%) |
| 1 Billion | 4.8% | 0.44%-0.65% | Top Age Group: 25–34
Top Gender: Male (56.9%) |
|
| 2 Billion | 1.16% | 0.9% | Top Age Group: 18–24 years
Top Gender: Male (52.7%) |
|
| TikTok | 1.14 Billion | 4.07% | 0.84% | Top Age Group: 18–24 years
Top Gender: Male (55.7%) |
| 2.9 Billion (MAU) | 0.15% | 0.90% | Top Age Group: 25–34
Top Gender: Male (56.7%) |
How to Turn Twitter (X) Stats Into Strategy (With Social Champ)
If you’ve made it this far, you’ve already seen the numbers: X (formerly Twitter) is still a high-impact platform in 2025.
From user behavior to ad performance, the stats tell a clear story.
But data alone doesn’t drive results; strategy does.
The question now is: how do you translate those insights into a smarter Twitter marketing strategy?
This section breaks it all down.
Whether you’re looking to increase engagement, post more effectively, or improve ad outcomes, here’s how to take what you’ve learned and turn it into action.
-
Lean Into Video Content
Video views on X have spiked, with video tweets pulling in higher engagement than static posts.
This means your strategy needs to incorporate short-form clips, behind-the-scenes looks, tutorials, and visual storytelling.
Videos grab attention faster and keep users engaged longer, which boosts your visibility in feeds.
Don’t underestimate the power of captions and clear visuals since many users watch without sound.
Prioritizing mobile-friendly formats will ensure your videos perform well across the majority of X’s audience.

An Example of a Video on X -
Post Strategically
Engagement metrics reveal that posting less but with higher quality now works better than daily noise.
Instead of spamming multiple tweets a day, focus on strategic timing and better storytelling.
Aim for 2–3 well-crafted tweets per week, especially during the middle of the week when engagement tends to peak.
-
Build Conversations, Not Just Impressions
The X algorithm favors replies and interactions more than ever.
That means retweeting, liking, and especially replying to trending conversations can boost your visibility.
Engage with relevant users in your niche.
Quote tweet influencers, jump into threads, and pose timely questions.
This increases your exposure and makes your brand more human.

Example of an Engaging Tweet -
Create Thread Campaigns, Not Just One-off Tweets
Threads continue to dominate on X—and not just among creators.
Brands are using them for everything from launching products to breaking down topics to running storytelling campaigns.
You can structure them around:
- Thought leadership topics
- Product walkthroughs
- Weekly “series” or recurring formats
- Behind-the-scenes brand stories
Or it can vary based on your brand or content strategy.
-
Double Down on High-Intent Content
Click-through rates on X vary widely by content type, but value-driven posts (think how-tos, expert tips, curated resources) outperform promotional posts.
Turn attention into action by always pairing value with a link or CTA.
Whether it’s a downloadable guide, newsletter sign-up, or product page, make the action clear.
Social Champ’s tracking tools help you monitor link clicks and optimize future posts around what actually converts.
-
Use Ad Reach and Demographic Data to Define Audience Targets
One of the most foundational pieces of Twitter/X ad data is reach.
Knowing the platform reaches approximately 6 million people monthly, with a core demographic of users aged 25–34, helps shape audience profiles for your content and campaigns.
Actionable Strategy:
- Segment your audience based on location, age, language, and device usage.
- If you’re in B2C retail and targeting Gen Z or millennials, prioritize creative formats like polls, videos, and memes that resonate with the 18–34 demographic.

Example of a Twitter Ad -
Optimize for Mobile Behavior
More than 88.55% of X’s user base is mobile-first. Long captions, heavy visuals, or complex links don’t work well.
What to do:
- Write tweets for the scroll. Keep them under 280 characters, break up threads into clean chunks, and use clear CTAs.
- Avoid link overload. X users prefer concise, compelling summaries—tease the value and let the link lead to a dedicated landing page.
-
Automate Low-Impact Tasks to Focus On Strategy
Time is a major constraint for most social teams. The more you can automate, the more you can focus on creative and strategic thinking.
Social Champ helps you turn insights into action by enabling you to:
- Segment content for specific audience groups based on demographics and interests.
- Schedule tweets and threads for peak engagement times with the best time to post feature.
- Collaborate efficiently with drag-and-drop calendars and role-based access.
- Track performance by content type and device for ongoing optimization.
Simply put, Social Champ streamlines your entire Twitter strategy, making it easier to stay consistent, targeted, and effective.
Featured Article: Social Media for Travel Agents: Proven Ideas to Get More Bookings
Twitter (X) Features in Numbers: Spaces, Communities, Blue & More
In 2025, Twitter (now X) has transformed into a multifaceted platform, offering various features that cater to diverse user needs.
Here’s a breakdown of key features and their impact:
Spaces: Real-Time Audio Engagement
Spaces provide a platform for real-time discussions, allowing users to engage in voice-based interactions.
Over 6.4 million Spaces have been created on the platform, where 2 million were created in a single month alone.
Communities: Niche Group Interactions
Communities enable users to connect with like-minded individuals, share interests, and participate in focused discussions.
Approximately 70,000 people join new communities daily on X, emphasizing the platform’s role in fostering niche group interactions.
Twitter Blue: Enhanced User Experience
Twitter Blue or X Premium offers subscribers early access to new features and updates.
This gives them a glimpse into the platform’s future and the chance to explore cutting-edge functionalities before they’re available to the general user base.
Currently, 650,000 users are subscribed to X Premium.
Subscribers enjoy perks like editing tweets, exclusive content, and prioritized support, enhancing their overall experience on the platform.

Unlock the Power of Data-Driven Insights with Social Champ!
Gain a deeper understanding of your audience, track engagement metrics, and refine your content strategy for maximum impact.
Conclusion
Twitter (X) in 2025 is changing, but it’s still a powerful platform for marketers.
The latest Twitter stats show that real-time conversations, video content, and new features like Spaces and Communities are shaping how people use the platform.
By understanding these changes and focusing on the right audience, content, and timing, marketers can connect better with users and grow their brands.
Using tools like Social Champ makes it easier to plan, schedule, and analyze your Twitter strategy so you can get the best results.
Staying updated with these Twitter stats and adapting your approach will help your brand succeed on Twitter (X) now and in the future.


1 comment
Men Gothic Trousers
Thanks for sharing this article with us. I would like to say please share this type of informative article with us. Thank you