After Musk’s infamous takeover of the beloved microblogging platform Twitter, the company saw a significant drop in its monthly users.
This fact led many marketers to believe Twitter is no longer the “It” social media and thus not important for marketing.
However, you would be surprised to know that despite the decline in its users, X (Twitter) still boasts around 106.23 million users just in the US and 335.7 million users worldwide.
However, navigating the platform and extracting valuable insights can be challenging without the right tools.
This is where you need to have good Twitter analytics tools in your martech kit.
Analytics tools help you gain a deeper understanding of your audience and optimize your content strategy and publish at optimal times with a social media scheduler.
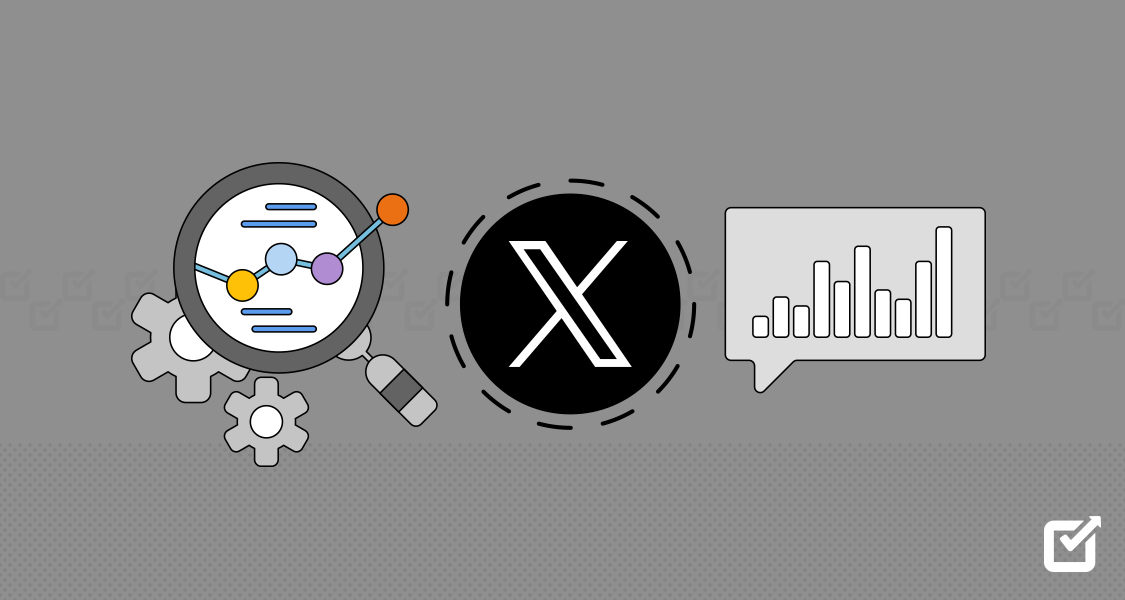
In this guide, we’ll explore the top 10 X/Twitter analytics tools that can reshape your social media approach in 2026.
Let’s get started!
Short Summary:
- Despite a decrease in user numbers, X remains a major platform with over 335 million users globally, making analytics tools crucial for maintaining effective marketing strategies.
- X analytics tools help track tweet performance, analyze follower data, and monitor SMM strategy effectiveness.
- Key features to look for include tweet performance metrics, follower insights, audience demographics, hashtag tracking, sentiment analysis, and customizable reporting.
- The top X/Twitter analytics tools include X Analytics, Social Champ, Brandwatch, Buffer, Meltwater, Twitonomy, Mentionmapp, Foller.me, Followerwonk, and Tweepi.
- Tools like Social Champ effectively combine analytics with scheduling to enhance content strategy and timing.
What Are X/Twitter Analytics Tools and Why Are They Important?
X/Twitter analytics tools are software platforms designed to help users track, analyze, and optimize their X performance.
These tools provide valuable insights into various aspects of your X activity, including follower growth, engagement rates, tweet performance, and audience demographics.
![10 Best X/Twitter Analytics Tools You Need in [current_year] 4](https://www.socialchamp.com/wp-content/uploads/2024/07/Calendar-v2.png "10 Best X/Twitter Analytics Tools You Need in [current_year] 5")
Decode Your Social Success With Social Champ X Analytics!
Understand what drives engagement, refine your strategy, and make data-driven decisions to amplify your growth. Turn insights into action now!
The importance of X/Twitter analytics tools cannot be overstated in today’s data-driven digital landscape. Here’s why they’re crucial:
- Data-Driven Decision Making: Analytics tools provide concrete data to inform your social media strategy, allowing you to make decisions based on facts rather than gut feelings.
- Performance Tracking: They help you monitor the success of your tweets, campaigns, and overall Twitter presence over time.
- Audience Understanding: These tools offer insights into your audience’s preferences, behaviors, and demographics, helping you tailor your content more effectively.
- Competitive Analysis: Many tools allow you to benchmark your performance against competitors, giving you a clear picture of where you stand in your industry.
- Time Optimization: By analyzing when your tweets perform best, you can schedule your content for maximum impact.
Overview of the Key Features of X/Twitter Analytics Tools
While features can vary between tools, here are some key functionalities you’ll find in most X analytics Twitter Platforms:
- Tweet Performance Metrics: Engagement rates, impressions, retweets, likes, and click-through rates for individual tweets.
- X/Twitter Follower Analytics: Monitor your follower count over time and identify patterns in growth or decline.
- Audience Insights: Demographic information about your followers, including location, interests, and active hours.
- Hashtag Analysis: Track the performance of hashtags you use and discover trending hashtags in your niche.
- Competitor Analysis: Compare your performance against other Twitter accounts in your industry.
- Sentiment Analysis: Gauge the overall sentiment (positive, negative, or neutral) of tweets mentioning your brand.
- Reporting: Generate customizable reports to share insights with team members or clients.
Featured Article: The Complete Guide to Twitter Polls
Best X/Twitter Analytics Tools in the Market
Here are the best Twitter analytics tools:
-
X Analytics

Snapshot of X analytics X’s native analytics tool is a great starting point for anyone looking to dive into the world of X metrics. It’s free and provides a solid foundation of insights.
Key Features
- Tweet activity dashboard
- Audience insights
- Event tracking
- Conversion tracking
Pros
- Free to use
- Directly integrated with Twitter
- Provides basic but essential metrics
Cons
- Limited in advanced features
- No competitor analysis
-
Social Champ
Social Champ dashboard Social Champ is a comprehensive social media management tool that includes robust Twitter analytics features and X scheduler.
It’s an all-in-one solution for scheduling, publishing, and analyzing your Twitter performance.
Key Features
- Detailed engagement metrics
- Recommendations on the best time to post on Twitter
- Competitor analysis
- Custom report generation
Pros
- User-friendly interface
- Social Listening
- Integrates analytics with scheduling features
Cons
- Paid tool (though offers a free trial)
- May have more features than needed for X-only users
By incorporating Social Champ into your strategy, you can harness the full power of X and transform your online presence.
Whether you’re looking to dive deep into analytics or streamline your posting schedule, Social Champ offers the tools necessary to achieve your goals.


[elementor-template id=”210816″]
-
Brandwatch
Brandwatch landing page Brandwatch is a great social listening and analytics tool that provides deep insights into X conversations and trends.
Key Features
- Advanced social listening
- Twitter sentiment analysis
- Influencer identification
- Custom dashboards
Pros
- Comprehensive data analysis
- Powerful visualizations
- Excellent for brand monitoring
Cons
- Can be complex for beginners
- Higher price point
-
Buffer
Buffer’s Dashboard Buffer is known for its scheduling capabilities but also offers solid analytics features for X and other social platforms.
Key Features
- Post performance analytics
- Audience demographics
- Engagement rate tracking
- Custom report creation
Pros
- Intuitive interface
- Integrates well with Buffer’s scheduling tools
- Affordable pricing options
Cons
- Analytics features not as advanced as some dedicated tools
- Limited to basic metrics
-
Coupler.io
Coupler.io X Ads Dashboard Coupler.io is a marketing analytics tool that lets you track paid performance on X by building a personalized ads dashboard with live campaign data.
Key Features
- No-code integration with X
- AI insights into performance
- Free X ads dashboard in Looker Studio
- Scheduled data refresh
Pros
- Ideal for campaign performance and ROI tracking
- Centralizes multi-platform data
- Highly customizable reporting
Cons
- Requires some setup for custom reports
- Focuses only on paid campaigns data
-
Meltwater
Meltwater landing page Meltwater specializes in influencer marketing but offers robust X analytics features as well.
Key Features
- Influencer discovery and analysis
- Audience demographics
- Campaign performance tracking
- Competitor benchmarking
Pros
- Excellent for influencer-focused strategies
- Detailed audience insights
- User-friendly interface
Cons
- More focused on influencer metrics than general X analytics
- Can be pricey for small businesses
-
Twitonomy
Twitonomy landing page Twitonomy is a dedicated X/Twitter analytics tool that offers a range of features for in-depth Twitter analysis.
Key Features
- Detailed user insights
- Tweet timing analysis
- Twitter hashtag tracker
- Competitor analysis
Pros
- Comprehensive Twitter-specific analytics
- Affordable pricing
- Easy to use
Cons
- Limited to Twitter only
- Some advanced features require paid subscription
-
Mentionmapp
Mentionmapp provides a unique visual approach to Twitter analytics, focusing on network connections and conversations.
Key Features
- Visual network mapping
- Hashtag and mention tracking
- Conversation analysis
- Real-time monitoring
Pros
- Intuitive visual representation of Twitter data
- Helpful for understanding network connections
- Real-time insights
Cons
- Focused more on network analysis than performance metrics
- Can be overwhelming for beginners
-
Foller
Foller landing page Foller is an X/Twitter analytics tool that provides quick insights into X profiles.
Key Features
- User profile analysis
- Tweet content breakdown
- Hashtag and mention tracking
- Activity patterns
Pros
- Free to use
- Quick and easy profile insights
- No account required
Cons
- Limited in-depth analytics
- No historical data analysis
-
Followerwonk
Followerwonk landing page Followerwonk, now part of Moz, focuses on X follower analysis and comparison.
Key Features
- Follower analysis and comparison
- Bio word cloud generation
- Best time to tweet suggestions
- Social authority scoring
Pros
- Excellent for understanding and growing your Twitter audience
- Integrates with Moz for SEO insights
- User-friendly interface
Cons
- Some features require a Moz Pro subscription
- Limited to follower-focused analytics


Featured Article: Inside Twitter Marketing – A Powerful Guide
-
Tweepi
Tweepi landing page Tweepi is a X/Twitter growth and management tool with built-in analytics features.
Key Features
- Follower growth tools
- Engagement analysis
- Competitor insights
- Automated cleanup suggestions
Pros
- Combines growth tools with analytics
- Helps identify inactive followers
- User-friendly interface
Cons
- More focused on growth than in-depth analytics
- Some users may find the automated suggestions too aggressive

Integrating Social Champ With Twitter Analytics Tools
While Social Champ offers analytics features on its own, it can also complement other Twitter analytics tools effectively. Here’s how:
- Comprehensive Dashboard: Social Champ’s dashboard can integrate data from multiple sources, including native X analytics, providing a centralized view of your Twitter performance.
- Scheduling Optimization: Use insights from various analytics tools to optimize your posting schedule in Social Champ, ensuring your tweets go out at the most effective times.
- Content Performance Analysis: Combine Social Champ’s content performance data with insights from other tools to get a holistic view of what content resonates best with your audience.
- Cross-Platform Insights: Social Champ’s ability to post all social media at once allows you to compare Twitter performance against other social networks, providing context to your Twitter analytics.
- Automated Reporting: Use Social Champ’s reporting features to compile data from various analytics sources into comprehensive, easy-to-understand reports.
Crack the Code of Twitter/X Engagement!
Unlock the full potential of your tweets with Social Champ’s X Analytics. Track key metrics, understand audience behavior, and fine-tune your strategy to make every tweet count.
Social Champ’s Analytics Capabilities
Social Champ offers a range of built-in analytics features that can provide valuable insights into your X performance:
- Engagement Metrics: Track likes, retweets, comments, and overall engagement rates for your tweets.
- Follower Growth: Monitor your follower count over time and identify trends in growth or decline.
- Best Time to Post: Analyze when your tweets receive the most engagement to optimize your posting schedule.
- Content Performance: See which types of content (text, images, videos) perform best with your audience.
- Hashtag Performance: Track the success of your hashtags and discover trending hashtags in your niche.
- Competitor Analysis: Compare your Twitter performance against competitors to benchmark your success.
- Custom Reports: Generate detailed reports on your Twitter performance for easy sharing with team members or clients.
Key Features to Look for in Twitter Analytics Tools
When choosing a Twitter analytics tool, consider these key features:
-
Real-Time Tracking and Monitoring of Tweets
Real-time tracking allows you to monitor mentions, hashtags, and keywords as they happen. This feature is crucial for:
- Responding quickly to customer inquiries or complaints.
- Joining trending conversations at the right moment.
- Monitoring campaign performance in real-time.
-
Detailed Insights on Tweet Performance
Look for tools that provide in-depth metrics on individual tweets, including:
- Engagement rate (likes, retweets, replies)
- Impressions and reach
- Click-through rates for links
- Video views and completion rates
This data helps you understand what content resonates best with your audience.
-
Follower Analysis and Engagement Metrics
Comprehensive follower analysis should include:
- Demographic information (age, location, interests)
- Follower growth over time
- Most engaged followers
- Best times to tweet based on follower activity
These insights help you tailor your content and posting schedule to your audience.
-
Competitor Analysis and Benchmarking
Competitor analysis features should allow you to:
- Compare your performance against competitors
- Identify gaps in your strategy
- Discover successful tactics in your industry
This information is invaluable for staying competitive on Twitter.
Featured Article: How to Promote Your Brand Using Twitter for Business
-
Customizable Reports and Data Export Options
Look for tools that offer:
- Customizable dashboards
- Flexible reporting options
- Data export in various formats (CSV, PDF, etc.)
These features make it easy to share insights with team members or clients and integrate Twitter data into your overall marketing reports.
Benefits of Using Twitter Analytics Tools
How Twitter Analytics Tools Improve Social Media Strategy
- Data-Driven Decision Making: Analytics tools provide concrete data to inform your content strategy, posting times, and audience targeting.
- Performance Tracking: Regularly monitoring your Twitter performance helps you identify what’s working and what’s not, allowing you to continually refine your approach.
- Audience Understanding: Insights into your audience’s preferences and behaviors help you create more relevant, engaging content.
- Competitive Edge: By analyzing your performance against competitors, you can identify opportunities to stand out in your industry.
Using Analytics to Optimize Tweet Timing and Frequency
- Best Time to Tweet: Analytics tools can identify when your audience is most active and engaged, allowing you to schedule tweets for maximum impact.
- Optimal Frequency: By analyzing engagement rates, you can determine how often to tweet without overwhelming your audience.
- Content Calendar Planning: Use historical data to plan your content calendar around peak engagement times and important events in your industry.
Enhancing Audience Engagement With Data-Driven Insights
- Content Optimization: Analyze which types of tweets (text, images, videos, polls) perform best and adjust your content mix accordingly.
- Hashtag Strategy: Identify which hashtags drive the most engagement and incorporate them into your tweets strategically.
- Audience Segmentation: Use demographic and interest data to tailor your content to different segments of your audience.
Tracking Campaign Performance and ROI
- Campaign Metrics: Measure the success of specific Twitter campaigns by tracking dedicated hashtags, engagement rates, and click-through rates.
- Conversion Tracking: Some tools allow you to track conversions from Twitter to your website, helping you calculate the ROI of your Twitter efforts.
- A/B Testing: Use analytics to compare the performance of different tweet variations, helping you refine your messaging for better results.
Best Practices for Using Twitter Analytics Tools
How to Set up and Configure Twitter Analytics Tools
- Connect Your Twitter Account: Start by securely connecting your Twitter account to your chosen analytics tool. For example, with Social Champ, you can easily link your Twitter profile in the dashboard.
- Set Your Goals: Define what you want to achieve with your Twitter analytics. Are you focusing on follower growth, engagement rates, or campaign performance? Set up your analytics tool to track these specific metrics.
- Configure Dashboards: Most tools, including Social Champ, allow you to customize your dashboard. Arrange the most important metrics for easy viewing.
- Set Up Alerts: Configure alerts for significant changes in your metrics, such as sudden spikes in mentions or drops in engagement.
- Integrate with Other Tools: If you’re using multiple tools, ensure they’re properly integrated. For instance, Social Champ can be integrated with various other marketing tools for a more comprehensive analysis.
Interpreting Data From Twitter Analytics Tools Effectively
- Look for Trends: Don’t focus on single data points. Instead, look for trends over time. Social Champ’s historical data feature is great for this.
- Compare Metrics: For example, don’t just look at raw follower numbers; compare them with engagement rates to get a full picture of your audience growth.
- Contextualize Data: Consider external factors that might influence your metrics, such as holidays or major events in your industry.
- Use Benchmarks: Compare your performance against industry standards or your own past performance to gauge improvement.
- Focus on Actionable Insights: Don’t get lost in vanity metrics. Focus on data that can inform your strategy, like content types that drive the most engagement.
Integrating Twitter Analytics With Other Social Media Platforms
- Cross-Platform Comparison: Use tools like Social Champ that offer analytics across multiple platforms to compare your Twitter performance with other social networks.
- Content Strategy Alignment: Use insights from Twitter to inform your content strategy on other platforms, and vice versa.
- Audience Overlap Analysis: Analyze how your Twitter audience overlaps with your audience on other platforms to create a cohesive cross-platform strategy.
- Unified Reporting: Use Social Champ’s reporting features to create comprehensive reports that include data from Twitter alongside other social platforms.
- Campaign Tracking: For multi-platform campaigns, use consistent hashtags and tracking parameters across all platforms for unified analysis.
Challenges and Solutions in Using Twitter Analytics Tools
Common Challenges Faced When Using Twitter Analytics Tools
- Data Overload: With so many metrics available, it’s easy to get overwhelmed.
- Solution: Focus on key performance indicators (KPIs) that align with your goals. Use customizable dashboards to display only the most relevant metrics.
- Interpreting Complex Data: Some analytics can be difficult to understand or apply practically.
- Solution: Invest time in learning about different metrics and their implications. Many tools, including Social Champ, offer educational resources and support.
- Keeping Up with Platform Changes: Twitter frequently updates its features and algorithms, which can affect analytics.
- Solution: Follow Twitter’s official announcements and updates from your analytics tool provider. Social Champ regularly updates its features to align with platform changes.
- Integrating Data Across Tools: Using multiple tools can lead to siloed data.
- Solution: Choose a comprehensive tool like Social Champ that integrates various aspects of social media management, including analytics.
- Proving ROI: Connecting social media metrics to business outcomes can be challenging.
- Solution: Use tools that offer conversion tracking and integrate with your website analytics. Set clear, measurable goals for your Twitter efforts.
- Real-Time Analysis: Twitter moves fast, and analyzing data in real-time can be difficult.
- Solution: Utilize tools with real-time monitoring features and set up alerts for important metrics or keywords.
- Accuracy of Data: Some tools may provide conflicting data.
- Solution: Compare data from multiple sources, including Twitter’s native analytics. Understand the methodology each tool uses to collect and present data.
Future Trends in Twitter Analytics
Upcoming Features and Advancements in Twitter Analytics Tools
- Enhanced Predictive Analytics: Tools will increasingly offer predictive features, helping users anticipate trends and optimize their strategies proactively.
- More Granular Audience Insights: Expect to see more detailed breakdowns of audience demographics, interests, and behaviors.
- Integration with E-commerce: As social commerce grows, analytics tools will likely offer more features to track and analyze purchase behaviors directly from tweets.
- Advanced Competitor Analysis: Tools may provide more in-depth comparisons, including share of voice and audience overlap analysis.
- Improved Visual Analytics: Expect more intuitive, visually appealing ways to present complex data, making it easier for non-technical users to understand insights.
How AI and Machine Learning Are Shaping the Future of Twitter Analytics
- Sentiment Analysis: AI is improving the accuracy of sentiment analysis, providing a more nuanced understanding of how audiences perceive brands and content.
- Content Recommendations: Machine learning algorithms will offer more sophisticated content recommendations based on historical performance and audience preferences.
- Automated Insights: AI will increasingly surface relevant insights automatically, reducing the need for manual data analysis.
- Predictive Engagement Scoring: Machine learning models will better predict how well a tweet will perform before it’s posted, allowing for real-time content optimization.
- Dynamic Benchmarking: AI will enable more dynamic and relevant benchmarking, automatically comparing your performance to similar accounts or industry standards.
Try Social Champ Free With a 14-Day Trial
Ready to take your X/Twitter analytics to the next level?
Try Social Champ free for 14 days and experience the power of integrated social media management and analytics.
Maximize your engagement and streamline your social media efforts with ease.
In Conclusion
Using Twitter analytics tools in your 2026 social media plan can change how you engage with your audience and boost your online presence.
These tools go beyond numbers, offering insights into audience behavior to help you create content that truly connects.
By examining hashtag performance and sentiment, you can craft engaging messages.
The insights allow for informed decisions, making your Twitter strategy effective and competitive.
As the digital world shifts, these tools are crucial for staying relevant. They help spot trends, refine strategies, and boost engagement, ensuring your brand stands out.