LinkedIn isn’t just a place to host your digital resume anymore. It’s 2026, and the platform has transformed into a massive, high-velocity professional ecosystem.
With new features, smarter LinkedIn tools, and endless opportunities, LinkedIn is now a must-use for businesses and marketers who want to reach an engaged, professional audience.
In this guide, we’re stripping away the corporate fluff to give you the real, updated data on:
- Who is actually on the platform? (Spoiler: Gen Z is growing faster than you think.)
- What content is winning? (Wait until you see the engagement rates on carousels vs. video).
- Where the marketing money is going.
- How global usage patterns have shifted across North America, Europe, and the booming Asia-Pacific market.
If you want to know where the professional world is heading this year, you’re in the right place. Let’s dive into the stats that actually matter for your 2026 strategy.
Short Summary
- LinkedIn has officially surpassed 1.3 billion registered members and 600 million monthly active users globally.
- The platform remains male-skewed at approximately 57% male to 43% female, though North American markets are nearing a 50/50 split.
- The 25–34 age group is the largest demographic, making up roughly 60% of the total user base, while Gen Z is the fastest-growing segment at 30% year-over-year.
- Over 53% of U.S. LinkedIn users report a household income of $100,000 or more, giving the audience double the buying power of average web users.
- B2B marketing is highly effective on the platform, accounting for 80% of all social media B2B leads with a 13% average conversion rate for lead-gen forms.
- Tuesday, Wednesday, and Thursday mornings between 9:00 AM and 12:00 PM are the peak windows for professional engagement.
- Weekday engagement is nearly 60% higher than weekend activity, as the platform remains a “work-mode” destination.
- The algorithm prioritizes early engagement in the first 60 minutes, making personalized posting times through tools like Social Champ essential for reach.
Key LinkedIn Statistics for 2026 (Quick Overview)
LinkedIn has solidified its position as the ultimate B2B powerhouse. From massive user growth to the rise of specialized content formats, here are the essential LinkedIn statistics and LinkedIn demographics you need to know:
Platform Reach & Growth
- Total Members: LinkedIn has officially surpassed 3 billion members globally as of early 2026.
- Monthly Active Users (MAUs): The platform now sees over 310 million MAUs, with projections to hit 600 million by the end of the year.
- User Growth: LinkedIn is growing by approximately 70 million members per year, which breaks down to about 2-3 new users every second.
- Global Footprint: Over 77% of users are now located outside of the U.S., with the Asia-Pacific region (277M members) leading regional growth
Engagement Benchmarks
- Top Performing Format: Native documents and carousels are the engagement kings, boasting a 0% median engagement rate.
- Video Power: Native video content receives 5x more engagement than static posts, with short-form video (under 60s) seeing the highest retention.
Marketing & Advertising ROI
- ROAS Advantage: The average Return on Ad Spend (ROAS) is 121%, significantly outperforming Google Search (67%) and Meta (51%) for B2B sectors.
- Ad Budget Shift: 41% of B2B digital ad budgets are now specifically allocated to LinkedIn.
LinkedIn Demographics Highlights
- The Core Segment: Users aged 25–34 make up the largest demographic, accounting for roughly 60% of the total user base.
- Decision Makers: There are now over 65 million business decision-makers and 10 million C-level executives active on the platform.
- High-Income Audience: In the U.S., 53% of LinkedIn users live in households earning over $100,000 annually.
Master LinkedIn Like a Pro!
LinkedIn User Growth & Platform Usage Statistics
LinkedIn has come a long way since its days as a digital filing cabinet for resumes. It has officially evolved into a high-velocity professional ecosystem where business actually happens in real-time. The growth isn’t just about the number of profiles; it’s about how deeply we’ve integrated the platform into our daily work lives.
Here is the breakdown of the latest LinkedIn usage and growth data:
- Total Users & Explosive Growth Trends
The sheer scale of the platform in 2026 is staggering. LinkedIn is no longer just a North American powerhouse; it is a truly global community.- Global Shift: While the S. remains the largest market (257M+), India is catching up fast with over 173 million users, followed by Brazil (94M+) and the UK (46M+).
-
Monthly & Daily Active Usage
Total sign-ups are one thing, but attention is the real currency. In 2026 professionals are logging in more frequently and staying longer.
- Monthly Active Users (MAUs): LinkedIn consistently sees 310 million MAUs, with projections suggesting it could cross the 600 million mark by the end of 2026.
- Daily Habits: Roughly 16.2% of total members (about 134.5 million people) log in every single day. If you only look at the monthly active crowd, that daily engagement rate jumps to 40%.
- Session Depth: The average visit now lasts 11.2 minutes, a significant increase from previous years as users move away from “scrolling” and toward “consuming” deep-dive content.
-
Professional Networking Behavior
The way we use LinkedIn has shifted from passive observing to active participation and “social selling.”
- The Content Gap: Here is your biggest opportunity: only 3% of users post content more than once a week. This means 97% of the platform is “lurking,” leaving the floor wide open for thought leaders to dominate the feed.
- Weekend Warrior Growth: Interestingly, weekend activity grew by 23% this year, showing that professionals are increasingly using their downtime to catch up on industry-long-form content.
Featured Article: Understanding Social Media Performance
LinkedIn Marketing & Advertising Statistics That Drive ROI
LinkedIn has solidified its position as the premier B2B marketing engine. While other platforms struggle with declining organic reach and rising non-branded search costs, LinkedIn has become the primary beneficiary of a great reallocation of B2B budgets.
Here is a breakdown of the critical performance metrics and benchmarks driving this shift:
-
Advertising Engagement & Conversion Rates
Engagement on LinkedIn is no longer just about likes; it’s about high-intent professional interaction.
- Average CTR (Sponsored Content): Typically ranges from 44% to 0.65% for single-image ads.
- Message Ads Open Rate: These continue to see massive success with open rates exceeding 50%, making them a top choice for direct response and event invites.
- B2B Conversion Rates: The platform sees an average conversion rate of 5% to 15%, depending on the offer.
-
Cost-Per-Lead (CPL) Benchmarks
LinkedIn is a premium platform, and its costs reflect the high value of its audience.
- Global Average CPC: The median cost-per-click hovers around $5.58 globally, but can exceed $10 for senior-level targeting.
- Efficiency Gains: Using native Lead Gen Forms can reduce your overall CPL significantly compared to external landing pages .
-
Why LinkedIn Ads Win for B2B Marketers
The ROI story for LinkedIn in 2026 is driven by three core factors:
- Audience Quality: 4 out of 5 LinkedIn members drive business decisions. Your ads reach the C-suite and directors who actually hold the budget.
- Positive ROAS: LinkedIn is currently delivering a 121% average Return on Ad Spend (ROAS) for B2B, outperforming Google Search and Meta.
- Video Acceleration: 81% of B2B CMOs believe that video accelerates sales cycles compared to other formats.
LinkedIn Engagement Statistics
In 2026, the algorithm has shifted heavily toward dwell time and meaningful conversations, making it critical to understand how users actually interact with the feed.
- Average Engagement & Interaction Rates
While many users observe silently, the baseline for a good post has climbed as more professionals adopt active posting habits.- Post-to-Follower Reach: Organic reach remains stable compared to other platforms, with most posts reaching 5% to 8% of a follower base.
- The Lurker Effect: While total membership is at 1.3 billion, only about 5.2% of daily active users post original content, meaning the majority of engagement comes from a small, highly active creator pool.
-
The Power of Documents and Carousels
In 2026, PDF carousels (uploaded as documents) are the undisputed kings of the feed. They keep users on a post longer, which the algorithm rewards with massive distribution.
-
Comment and Share Behavior
LinkedIn has deprioritized “empty” reactions (like the simple Thumbs Up) in favor of signals that indicate real value.
- Comment Weighting: Comments are now weighted 15x heavier than likes in the algorithm. A post with 10 thoughtful comments will often out-distribute a post with 100 likes but no discussion.
- The Reply Bonus: Creators who reply to comments within the first 2 hours see a 30% lift in the total engagement lifecycle of that post.
- Sharing Habits: Users are 20x more likely to share video content than any other format, making video the primary driver for “viral” expansion beyond a user’s immediate network.
-
What Content Performs Best?
To win on LinkedIn in 2026, your strategy must move away from broadcasting and toward educating.
- Educational How-To’s: Frameworks, industry insights, and practical tips formatted as document carousels currently generate the highest reach.
- Short-Form Video: Videos between 30 and 90 seconds that solve a specific problem or share a human story are thriving, especially those that include subtitles for sound-off viewing.
- Vulnerable Storytelling: Research shows that vulnerable or personal lesson-based posts attract 5x more engagement than standard corporate updates.
- Polls: Despite their age, polls remain effective for impression-hacking, as every vote is tracked as an active engagement signal by the algorithm.
LinkedIn Video Statistics
If there is one thing that has fundamentally changed the LinkedIn feed in 2026, it’s the shift toward a video-first experience.
- The Explosive Growth of Video Content
Video is currently the fastest-growing format on the platform, driven by a new generation of professionals who prefer visual storytelling over long-form articles. -
Video vs. Text: The Engagement Gap
While text posts are still excellent for building intimate conversations within your immediate network, video is the undisputed king of reach and discovery.
- Interaction Multiplier: Native LinkedIn video generates 5x more engagement than standard text-only posts.
- The Share Factor: LinkedIn users are 20x more likely to share a video post than any other content type, which is the primary reason video content goes viral beyond your 1st-degree connections.
- Engagement Rates: According to 2026 benchmarks, video posts see an average engagement rate of 6% to 6.0%, compared to roughly 4.0% to 4.5% for text posts.
-
How Brands Use LinkedIn Video Marketing
In 2026, successful brands have moved away from high-production commercials and toward “native-feeling” content.
- Short-Form Dominance: Short-form videos (under 60 seconds) achieve a 5.4% engagement rate and a 62% completion rate, significantly outperforming longer webinars or sales pitches.
- LinkedIn Live: For real-time engagement, LinkedIn Live is a powerhouse, receiving 7x more reactions and 24x more comments than standard pre-recorded videos.
- Captions are Non-Negotiable: Because 57% of LinkedIn traffic is mobile—and often consumed with the sound off—adding captions increases watch time by 32% and engagement by 29%.
LinkedIn Recruiting & Job Statistics
LinkedIn has essentially become the global operating system for the modern labor market. In 2026, it is no longer just a place to find a job; it is where the world’s talent is mapped, screened, and hired in real-time.
- The Power of the Recruiter Network
LinkedIn’s dominance is driven by the fact that the people with the power to hire are actually on the platform every day.- Recruiter Adoption: Approximately 89% of recruiters and B2B marketers use LinkedIn as their primary tool for talent acquisition.
- Daily Sourcing: A staggering 91% of recruiters access the platform daily to source, message, and manage candidates.
- Direct Access: The platform provides recruiters direct access to over 65 million business decision-makers and 10 million C-level executives.
-
Job Posting & Application Volume
The scale of activity on LinkedIn’s job board has reached new heights in 2026, largely fueled by AI-driven matching and one-click applications.
- Weekly Activity: Roughly 78 million professionals use LinkedIn to search for jobs every single week, a 20% increase from 2024.
- AI Influence: 34% of all job applications are now driven or assisted by AI auto-apply tools, contributing to the massive volume of submissions.
-
Hiring Success & Quality Metrics
For companies, the platform isn’t just about quantity; it’s about the quality of hire, which remains LinkedIn’s strongest selling point.
- Hire Frequency: On average, 9 people are hired every minute on LinkedIn globally, totaling roughly 4.7 million annual hires.
- Quality Perception: 72% of recruiters believe that candidates hired through LinkedIn are of higher quality than those found on other job boards.
- The Connection Advantage: You are 6x more likely to be hired if you are connected to an employee at the company you are applying to.
- Speed to Interview: Nearly 60% of hirers find a candidate they want to interview within the first week of posting a role.
-
Why LinkedIn Is the #1 Hiring Platform
LinkedIn has outpaced traditional job boards like Indeed or Monster for three specific reasons:
- Passive Candidate Access: Most job boards only show you people actively looking. LinkedIn allows recruiters to find passive candidates—highly qualified people who aren’t looking but might move for the right offer.
- Verified Professional Identity: Profiles act as a living resume validated by endorsements, recommendations, and mutual connections, which reduces the trust gap for hiring managers.
- Skills-First Hiring: In 2026, LinkedIn shifted its focus toward skills-based workforce planning. Recruiters can now search for the 41,000+ specific skills listed on the platform rather than just job titles.
LinkedIn Company Statistics
LinkedIn Company Page is no longer just a digital placeholder; it’s a central hub for brand authority and community building. As the platform shifts toward human-centric content, businesses are finding that success requires moving beyond corporate broadcasting to showcase the people and expertise behind the logo.
- Business Presence & Growth
LinkedIn has seen a massive surge in corporate adoption as more organizations move their primary B2B marketing efforts away from traditional web search and toward the professional feed.- Total Organizations: There are now over 70 million companies with an active presence on LinkedIn.
- Educational Hubs: In addition to businesses, over 160,000 schools and universities use the platform to connect with alumni and recruit students.
- The Active Advantage: Companies that fully complete their page profiles and post at least weekly receive 5x more page views, 7x more impressions, and 11x more clicks per follower compared to inactive pages.
-
Company Page Engagement Benchmarks
Engagement for brands has become more competitive in 2026, with the algorithm heavily favoring high-value, interactive formats.
- Average Engagement Rate: The platform-wide benchmark for company pages currently stands at 5.20%, an 8% increase year-over-year as brands improve their content quality.
- Top Performing Formats:
- Native Documents/Carousels: 7.00% engagement (the highest on the platform).
- Multi-Image Posts: 6.45% engagement.
- Video: 6.00% engagement.
- The Employee Factor: Employee advocacy is the secret ingredient for brands. Content shared by employees sees 8x more engagement than the exact same content shared by a company page.
-
Business Marketing & Lead Generation
LinkedIn is the undisputed leader for B2B marketers, particularly for those focused on high-ticket sales and complex decision-making cycles.
- Marketing Adoption: A staggering 96-97% of B2B marketers use LinkedIn for organic content distribution.
- Lead Generation Dominance: LinkedIn accounts for 80% of all B2B leads coming from social media. Additionally, 62% of B2B marketers claim it generates the highest quality leads—more than double the rate of any other social platform.
- Purchase Intent: Buyers who are exposed to a brand’s content on LinkedIn are 6x more likely to purchase from that brand, and LinkedIn ads drive a 33% increase in purchase intent.
LinkedIn Age Distribution Statistics
LinkedIn is no longer just for senior executives and the suits. The platform has undergone a massive generational shift, becoming the primary digital playground for Millennial leaders and the rapidly growing Gen Z workforce.
-
LinkedIn Users by Age Group
Understanding the LinkedIn demographics by age is crucial for tailoring your content’s vibe and utility. Here is the current global distribution:
- 18–24 (Gen Z):7% to 25% of the user base. This group is primarily students and early-career professionals.
- 25–34 (Millennials):6% to 60.1% of the user base. This is the dominant power demographic on the platform.
- 35–54 (Gen X & Older Millennials): Roughly 19.2% to 21.2% of the user base. These are your mid-to-senior-level managers and directors.
- 55+ (Baby Boomers): Only 3.1% to 3.8% of the total user base.
-
Most Active Age Groups & Trends
While Millennials hold the most profiles, the activity patterns are shifting as younger professionals treat LinkedIn more like a “career social network” than a static resume.
- The Millennial Stronghold: The 25–34 age group remains the most active, accounting for nearly 60% of all original content shares. They are the primary drivers of the platform’s daily engagement.
- Gen Z Growth Explosion: Gen Z is the fastest-growing segment on LinkedIn, with adoption growing at 30% year-over-year. Interestingly, 25% of all new members in 2026 are under the age of 25.
- The “Founder” Trend: Younger professionals are opting for self-employment at record rates. The number of members adding “Founder” to their profiles grew by 60% recently, largely driven by Gen Z’s interest in entrepreneurship.
LinkedIn Gender Composition Statistics
Understanding the gender makeup of LinkedIn is essential for B2B marketers and recruiters looking to optimize their reach. As of early 2026, the platform continues to show a measurable gap in user distribution, though engagement patterns tell a more nuanced story.
-
Global Gender Distribution
Metric Percentage Male Users 56.8% – 56.9% Female Users 43.1% – 43.2% In the core professional demographic (ages 25–34), the gap is slightly more pronounced, with men representing roughly 26.8% of the total advertisable audience compared to 20.5% for women. However, certain regions like North America show a much more balanced, nearly 50/50 split.
-
Gender Trends in Professional Networking
Beyond raw numbers, behavioral trends highlight significant differences in how genders navigate the platform:
- The Confidence Gap in Job Hunting: Historical and recent data suggest women are 16% less likely to apply for a job after viewing it. Research indicates women often feel they must meet 100% of the listed criteria, whereas men often apply after meeting only 60%.
- Networking Homophily: Users tend to connect with others of the same gender. Women are 13% more likely to send invitations to other women, while men are 6% more likely to invite other men.
- The Visibility Debate: A notable 2025/2026 trend (often tagged as #wearthepants) saw women reporting massive spikes in post reach, up to 400%, after temporarily changing their profile gender to “male.” While LinkedIn denies using gender as an algorithmic signal, these experiments have sparked a global conversation about “proxy bias” and how AI might inadvertently favor more assertive, traditionally “masculine” communication styles.
Geographic Distribution of LinkedIn Users
LinkedIn’s reach is truly global, spanning over 200 countries and territories.
- Top Countries Using LinkedIn
While the United States remains the platform’s primary market, international growth is accelerating. Over 80% of LinkedIn’s members now reside outside of the U.S.Country Registered Users (Approx.) United States 257 Million India 173 Million Brazil 94 Million United Kingdom 46 Million France 37 Million -
Global Market Penetration
LinkedIn’s penetration is highest in developed economies, but its density in professional hubs is a better indicator of its influence than raw population percentages.
- High-Saturation Markets: In the United States, roughly 53% of college graduates are on the platform. Similarly, in the UK, nearly 47.5 million professionals, the vast majority of the nation’s workforce, hold active accounts.
- Active vs. Registered: While there are 1.3 billion accounts, Monthly Active Users (MAUs) are estimated at approximately 600 million. In the European Union, the activity rate is roughly 34% of the total registered base.
- Corporate Density: LinkedIn now hosts over 71 million companies and 142,000 schools, making it the digital twin of the global economy.
-
Regional Growth Trends
The center of gravity for LinkedIn is shifting toward the Asia-Pacific (APAC) and Latin America (LATAM) regions.
- APAC Surge: The Asia-Pacific region is now the largest regional bloc by volume, with over 373 million members. India is the primary driver here, showing the fastest growth in entrepreneurship indicators, with a 104% increase in members adding “Founder” to their profiles.
- Emerging Markets: Beyond India, markets like Indonesia (37M users) and the UAE (+37% growth) are showing double-digit increases in engagement, specifically within AI-related job roles and skill acquisitions.
- Gen Z Adoption: Globally, Gen Z is the fastest-growing demographic on the platform, with a 30% annual increase in adoption. This is particularly visible in France and Germany, where younger professionals are turning to LinkedIn for skills-based hiring opportunities.
LinkedIn Income Demographics Statistics
LinkedIn is widely recognized as the most affluent social network. Its user base is not just large; it is financially empowered, with a significant portion of members falling into high-earning brackets that are typically difficult to reach on other platforms.
-
High-Income Professional Representation
Data from early 2026 confirms that LinkedIn users have significantly higher purchasing power than the general internet population. In the United States, the platform’s audience is heavily weighted toward high earners.
- The $100k+ Club: Approximately 53% of U.S. LinkedIn users report a household income of over $100,000 annually.
- Affluence Distribution: Another 29% fall into the middle-income bracket, while only 18% report low-income status.
- Global Purchasing Power: Globally, LinkedIn members have 2x the buying power of the average web audience, making the platform a “goldmine” for both B2B and premium B2C brands.
-
LinkedIn’s Appeal to Decision Makers
The platform’s primary value proposition for marketers is its concentration of professional gatekeepers. LinkedIn has evolved into a hub where the people holding the budgets are actively engaged.
- Volume of Authority: There are over 65 million business decision-makers and 10 million C-level executives active on the platform.
- Influence Factor: 4 out of 5 LinkedIn members drive business decisions at their organizations. This means 80% of the audience has the authority to say “yes” to a proposal or purchase.
- Senior-Level Reach: LinkedIn hosts approximately 180 million senior-level influencers, ensuring that marketing messages reach those who shape long-term corporate strategy.
-
How Income Demographics Impact B2B Marketing
Because the audience is affluent and professional, marketing strategies on LinkedIn differ fundamentally from those on “entertainment-first” platforms like TikTok or Instagram.
- Lead Quality vs. Quantity: LinkedIn generates 80% of all B2B leads coming from social media. While the Cost Per Click (CPC) is often higher (averaging $10.11–$11.04), the conversion rate for Lead Gen Forms is a staggering 13%, nearly triple the industry average for standard landing pages.
- Thought Leadership Over Promotion: High-income users show a distinct preference for data-driven insights and market analyses. In fact, 64% of B2B buyers state they favor thought leadership content over traditional product sheets when assessing a vendor’s capabilities.
- Executive Visibility: Content shared by CEOs and C-suite executives receives 4x more engagement than brand-only posts, as high-income peers prefer “person-to-person” professional interaction.
Career Level Demographics of LinkedIn Users
LinkedIn’s unique value lies in its concentration of professional seniority. Unlike other social platforms that primarily capture leisure time, LinkedIn captures career time, resulting in a user base heavily weighted toward experienced professionals and corporate leaders.
-
Career Seniority Distribution
As of 2026, LinkedIn has moved beyond being just a job board for entry-level seekers. The platform’s 1.3 billion members are distributed across all career stages, with a massive middle-to-senior layer that drives global B2B commerce.
Seniority Level Characteristics Estimated Share Entry Level Students, recent grads, and specialists (Age 18–24). 21.70% Managers Individual contributors moving into leadership. 30.00% Directors Mid-to-senior leaders overseeing departments. 15.00% Executives VP-level and C-Suite (CEO, CTO, etc.). 10.00% -
Key Segments Breakdown
- Entry Level & Gen Z (18–24)
This is the fastest-growing demographic on the platform, growing at 30% year-over-year. These users are primarily focused on “skills-based” networking and are 3.6x more likely to get hired if they have a direct connection at a company. - Managers & Mid-Career (25–34)
The powerhouse of LinkedIn, making up over 60% of the total user base. This group is the most active in sharing original content and building professional brands. They are often the gatekeepers who vet new tools and services before they reach the executive level. - Directors & Senior Level Influencers
LinkedIn currently hosts over 180 million senior-level influencers. These individuals are critical for B2B “social selling” because they bridge the gap between technical execution and high-level strategy. - Executives & C-Suite
There are approximately 10 million C-level executives active on LinkedIn. Interestingly, content shared by CEOs receives 4x more engagement than content from standard brand pages, proving that “person-to-person” leadership is the most effective way to reach other high-level peers.
- Entry Level & Gen Z (18–24)
-
Why LinkedIn is the Gold Standard for Decision-Maker Targeting
For B2B marketers, the seniority of the audience is more important than the size.
- Buying Power: 4 out of 5 LinkedIn members drive business decisions. This means 80% of the audience has the authority to influence or finalize a purchase.
- Trust Factor: 73% of decision-makers state they trust thought leadership content found on LinkedIn more than traditional marketing or advertising.
- Direct Access: Unlike traditional email where a gatekeeper (like an assistant) might filter messages, LinkedIn allows for direct peer-to-peer outreach to the 65 million decision-makers on the platform
Best Times to Post on LinkedIn (Based on Data)
Timing your content on LinkedIn is the difference between a post that ghosts and one that starts a global professional conversation.
- The Data-Backed Winners: Best Days & Windows
Recent 2026 studies from platforms like Social Champ highlight a clear professional prime time where engagement is most concentrated.Day Best Time Windows (Local Time)
Engagement Profile Tuesday 9:00 AM – 12:00 PM Peak Day: Highest overall volume and response rates. Wednesday 10:00 AM – 2:00 PM Midweek Sweet Spot: Focus on “Lunch Break” scrolls. Thursday 9:00 AM – 1:00 PM Consistent Activity: Strongest window for B2B leads. - The Golden Hour: Regardless of the day, the 10:00 AM to 11:00 AM slot remains the most reliable window for capturing professionals during their mid-morning “coffee break” scroll.
- Early Bird Special: For B2B and Tech sectors, an earlier window of 7:00 AM – 9:00 AM is highly effective for catching executives before their back-to-back meetings begin.
-
Weekday vs. Weekend Engagement
LinkedIn remains a work-mode platform, and the data reflects a sharp divide between the workweek and the weekend
- The Weekday Advantage: Approximately 80% of all LinkedIn engagement occurs between Monday and Friday, 9:00 AM to 5:00 PM. Mondays start slow (peak at 11 AM) as people clear inboxes, while Friday engagement drops off significantly after 2:00 PM.
- The Weekend “Ghost Town”: Weekend engagement is generally 58% lower than midweek. However, a small “Inspiration Window” exists on Saturdays (10:00 AM – 12:00 PM) for personal branding and career reflections.
- The Sunday “Prep” Spike: Sunday evenings around 6:00 PM see a minor surge as “Strivers” prepare for the week ahead—ideal for newsletters or long-form thought leadership.
Stop Guessing With Social Champ’s Best Time to Post
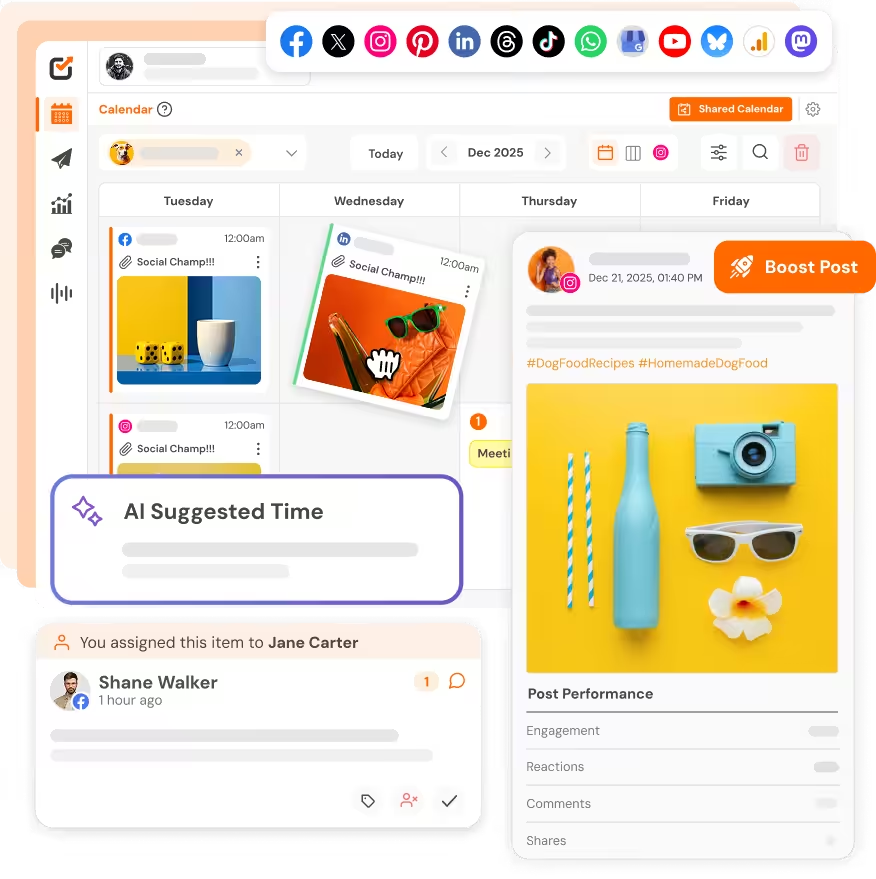
Finding your personal “Golden Hour” shouldn’t involve a spreadsheet. Social Champ’s AI-Suggested Time feature does the heavy lifting for you by analyzing your specific account’s history and your followers’ active hours.
Instead of following general averages, Social Champ gives you personalized recommendations based on when your unique audience is actually hitting the “Like” button. You can schedule your entire week in minutes, ensuring every post lands at the exact moment it’s most likely to go viral.
Unleash LinkedIn Power at THE Perfect Moment!
Tips for Leveraging LinkedIn Statistics in Your Strategy
Now that you’ve reviewed the key LinkedIn statistics, it’s time to put them into practice.
Here are some actionable tips to help you optimize your LinkedIn strategy based on these insights:
- Create Engaging Content
Video content and long-form articles remain the most engaging types of posts on LinkedIn.
These formats are ideal for building thought leadership and attracting a professional audience.
When creating content, aim to provide real value—whether it’s in-depth industry insights, practical tips, or expert opinions.
High-quality, informative posts are more likely to generate shares, comments, and engagement.
Additionally, incorporating infographics, images, and other visual elements can significantly boost your post’s performance and make complex topics more digestible.
Remember, engagement on LinkedIn is often about quality over quantity.
Tailor your content to your audience’s interests, challenges, and goals, ensuring it resonates with them personally or professionally. - Schedule Posts at Optimal Times
The timing of your posts plays a key role in ensuring they reach the widest possible audience.
Studies show that 8 AM – 10 AM and 4 PM – 6 PM are the best times to post on LinkedIn, as these windows correspond to when professionals are most likely to be active on the platform.
However, since every audience is unique, testing different time slots will give you insights into when your specific followers are most engaged.
To make this process easier, tools like Social Champ allow you to schedule posts in advance, ensuring they go live at the most effective times, even if you’re unavailable to post manually.
This will help you maintain a consistent posting schedule without any hassle. - Experiment With LinkedIn Ads
LinkedIn’s advertising platform is a great way to increase visibility and generate high-quality leads, especially in B2B marketing.
Experiment with different ad formats such as sponsored content, message ads, and text ads.
Sponsored content appears directly in your target audience’s feeds, making it highly visible, while message ads offer a more personal touch by reaching your audience’s inbox.
Testing a variety of ads, creatives, and targeting options will help you find the most effective combination for your business.
Click-through rates (CTR), conversion rates, and engagement levels are key metrics for evaluating ad success.
According to recent studies, CTR for LinkedIn ads typically ranges from 0.39% to 0.65%, but with optimization through A/B testing, you can push it higher.
Engagement levels also vary by industry, with B2B companies often seeing an average engagement rate of 0.54%.
A/B testing different headlines, images, and calls-to-action can help you optimize ad performance over time. - Analyze Your Performance
To ensure your LinkedIn strategy is working, use LinkedIn’s analytics tools, along with third-party platforms like Social Champ, to track your content’s performance.
Look at key metrics like engagement rate, impressions, clicks, and follower demographics to assess how your content is performing.
Pay attention to which types of content generate the most interaction and what posting times result in the highest engagement.
Regularly analyzing your performance will help you identify trends and adjust your strategy accordingly.
For instance, if you notice that video content consistently generates more engagement, prioritize video in your content plan.
Understanding which posts resonate with your audience will help you refine your approach and boost results.
Conclusion
LinkedIn in 2026 continues to be one of the most powerful platforms for marketers, recruiters, and business owners.
By understanding LinkedIn’s demographics, user behavior, and advertising capabilities, you can develop a robust strategy that maximizes your reach, engagement, and conversions.
Whether you’re looking to connect with professionals, generate B2B leads, or recruit top talent, LinkedIn offers unmatched opportunities.
Implement the tips and insights shared in this blog, and use tools like Social Champ to automate and optimize your LinkedIn marketing efforts for maximum success.
Frequently Asked Questions
1. How Many Users Does LinkedIn Have?
2. What Percentage of Professionals Use LinkedIn?
3. Which Age Group Uses LinkedIn the Most?
4. Is LinkedIn Effective for B2B Marketing?
5. How Often Should You Post on LinkedIn?