Scrolling through social media might feel like second nature by now, but if you’re a brand or marketer, you know it’s anything but casual.
The platforms, the users, the algorithms, everything is evolving at lightning speed. That’s why understanding the latest social media statistics is essential.
As of early 2025, over 5.42 billion people actively use social media worldwide. That’s more than 67% of the global population.
Short Summary
- Over 5.42 billion people use social media globally, spending an average of 2 hours and 24 minutes per day—highlighting the need for data-driven marketing.
- Millennials (ages 28–43) are the most active users, while Gen Z dominates TikTok and Instagram, revealing critical age-based behavior in social media statistics.
- Mobile devices account for 99% of social media access, reinforcing the importance of mobile-first content strategies for better reach and ROI.
- Regional growth trends show that Asia leads in global social media usage, making it a vital market for brands aiming to expand their reach in 2025.
- Social media marketing statistics show that Facebook and Instagram offer the highest ROI.
But it’s not just about the numbers, it’s about what those numbers tell you. Where are users spending their time? What kind of content are they actually engaging with? And more importantly, what does this mean for your next campaign?
This blog unpacks the most relevant social media statistics of 2025, helping you decode user behavior, platform trends, content performance, and more.
And if you’re serious about applying these insights, a reliable social media management tool like Social Champ can make all the difference.

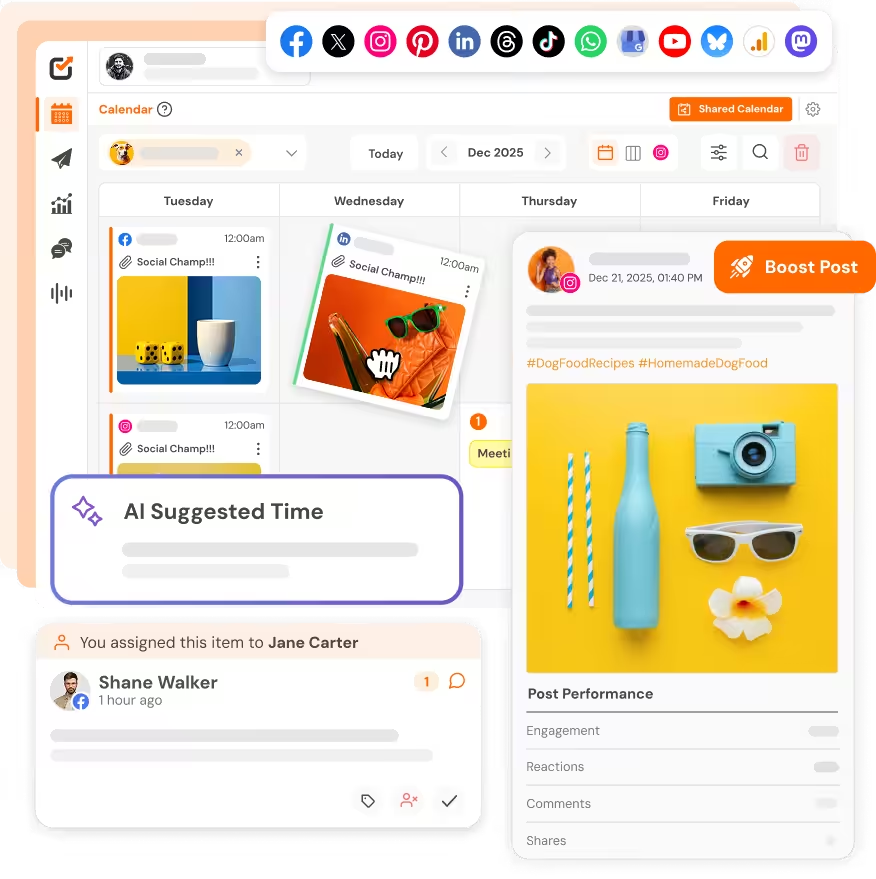
Looking for the Ultimate Social Media Assistant?
From scheduling to performance tracking, Social Champ is your all-in-one tool to effortlessly manage your online presence.
Social Media Statistics Overview: Global Usage Trends in 2025
In 2025, social media continues to see widespread global adoption, with total user numbers reaching new heights.
Billions of people around the world now engage with various platforms daily, spending an average of several hours per day online.
- On average, individuals spend around 2 hours and 24 minutes per day on social platforms, a figure that has remained relatively stable over recent years.
When it comes to platform popularity, a few major players still dominate the rankings based on active users, though shifts in user preferences and platform features are causing some changes in the hierarchy.
Regional growth patterns show significant variation.
- Asia leads the way in global social media usage, making up nearly 60% of all users. Europe follows with around 12%, while Africa is quickly growing and now holds over 11%.
South America and North America account for smaller shares, and Oceania, including Australia, represents just a small fraction.
Social Media Demographics: Who’s Using Which Platform (and Why)
Social media usage in 2025 reflects a diverse and dynamic global population, with patterns of engagement shaped by age, gender, geography, device preferences, and personal motivations.
Understanding who uses which platforms and why provides valuable insight into the evolving role of social media in everyday life.
While overall trends offer a broad picture, platform-specific differences reveal how each service attracts and retains its unique audience.
Here is a general overview followed by a breakdown across key demographic dimensions.
-
Social Media Statistics by Age
Across all platforms, younger users remain the most active demographic, particularly those in the 18–34 age range.

Infographic for Social Media Stats by Age However, older age groups are increasingly embracing social media, especially on platforms that prioritize ease of use and community engagement.
- Gen Z (12–27 years): 25% of social media users. Highly active on TikTok (39% of its global audience) and Instagram (34%).
- Millennials (28–43 years): 37% of all social media users. Dominant on Facebook, comprising 32% of its user base.
- Gen X (44–59 years): 28% of all social media users. Strong presence on Facebook and LinkedIn.
- Baby Boomers (60+ years): Only 10% of the social media population. Increasingly active, particularly on Facebook and YouTube.
Daily Time Spent on Social Media by Each Age Demographic
The overall trend highlights that younger users remain significantly more engaged with social media compared to older demographics.
According to recent data, daily time spent on social media varies across age groups. Users aged 16 to 24 are the most active, spending an average of 3 hours and 1 minute per day on social platforms.
The 25 to 34 age group follows, with 2 hours and 37 minutes of daily usage.
Engagement gradually decreases with age; 35 to 44-year-olds average 2 hours and 4 minutes, while those aged 45 to 54 spend around 1 hour and 39 minutes each day.
The lowest engagement is among users aged 55 to 64, who spend just 1 hour and 13 minutes daily.

Source: Digital Information World -
Social Media Statistics by Gender
Globally, the gender split among social media users is slightly skewed towards females, with 48.4% male and 51.6% % female users.
However, this distribution can vary by region and platform. For instance, in South Asia, males constitute 72% of social media users, while females make up 29%.
Understanding these differences is crucial for tailoring content and marketing strategies effectively.
-
Social Media Marketing Statistics by Device Usage
The vast majority of social media access occurs via mobile devices, with 99% of users engaging through smartphones.
This trend emphasizes the importance of mobile-optimized content and user experiences.
While desktop usage still exists, especially in professional settings, the dominance of mobile access shapes how content is consumed and shared.
-
Social Media Stats by Country
Social media adoption varies significantly across countries. Here are some contributors to worldwide social media usage.
As of 2025, the top countries by number of social media users are:
- China: 1.1 billion users
- India: 462 million users
- United States: 239 million users
- Brazil: 144 million users
- Indonesia: 139 million users
- Russia: 106 million users
- Japan: 96 million users
- Mexico: 90.2 million users
- Philippines: 86.8 million users
- Vietnam: 72.7 million users
-
Social Media Statistics by Usage Purpose
Individuals engage with social media for various purposes, which often correlate with age:
- Social Connection: This remains a primary reason across all age groups, with over 72% of individuals on Facebook using it to stay in touch.
- Entertainment and Leisure: Younger users, particularly those aged 16 to 24, often use social media to fill spare time, with 42.7% citing this as a primary reason.
- Accessing News and Information: A significant portion of users turn to social media for news, with over 30% of adults accessing news through these platforms.
- Product Research and Brand Interaction: More than 40% of internet users utilize social media for researching products, and 54.3% follow and research brands.
- Professional Networking: Used by over 44% of social media users for professional networking.
Social Media Advertising Statistics: Performance, Spend & ROI
In 2025, social media advertising will remain one of the most effective channels for digital marketers, driven by its massive reach, targeted delivery, and measurable results.
On average, brands are seeing increased investment in paid social media, with overall ad spend continuing to climb year-over-year.
Metrics like average Cost Per Mille (CPM), Click-Through Rate (CTR), ad reach, and conversion rates provide valuable benchmarks for campaign performance across platforms.
-
Average CPM (Cost Per 1,000 Impressions)
The average cost for advertisers to reach 1,000 users across all social media sites is approximately $6.06, reflecting a slight increase from previous years.
-
Average CTR (Click-Through Rate)
The global average click-through rate for social media ads stands at 0.98%, indicating the percentage of users who click on an ad after viewing it.
-
Ad Reach
As of 2025, social media ads reach over 5 billion users globally, with platforms like YouTube and Facebook delivering the highest ad exposure, 2.54 billion and 2 billion users, respectively. Ad spend is projected to hit $276.7 billion, driven largely by mobile-optimized video content and platform diversification.
-
Average Conversion Rates
Conversion rate indicates the percentage of users who complete a desired action (e.g., purchase, sign-up) after clicking an ad. In 2025, average conversion rates, as reported by Business Dasher, are:
- Facebook: 9.21%
- Instagram: 1.08%
- YouTube: 1.47%
- LinkedIn: 2.35%
- TikTok: 3.4%
- Twitter/X: 0.77%
-
ROI (Return on Investment)
While specific ROI figures vary across platforms and industries, social media advertising continues to deliver significant returns.
In 2025, ROI by platform is:
- Facebook: 28%
- Instagram: 22%
- YouTube: 2612%
Facebook and Instagram deliver the highest ROI, making them attractive options for advertisers seeking cost-effective campaigns.
Tired of the Social Media Hassle?
Simplify your workflow with Social Champ’s automated posting, cross-platform management, and detailed reporting.
Platform-Specific Social Media Statistics (Facebook, Instagram, TikTok, X, LinkedIn & More)
In 2025, each major social media platform offers unique opportunities for marketers, driven by distinct user demographics, engagement patterns, and regional preferences.
Here’s a concise overview of the most impactful statistics across Facebook, Instagram, TikTok, X (formerly Twitter), LinkedIn, and Pinterest.
-
Facebook

Facebook Homepage - Active Users: Facebook has approximately 3.065 billion monthly active users globally.
- Gender Distribution: Globally, 56.7% male and 43.3% female.
- Top Countries: Facebook’s top users reside in India (581.6M users) United States(279.8M users), and Brazil (175.1M users).
- User Interaction: The average Facebook user interacts with at least 10 posts daily through likes, shares, or comments.
-
Instagram

Instagram’s Homepage - Active Users: Instagram has over 2 billion monthly active users.
- Gender Distribution: Globally, 50.6% male and 49.4% female.
- Top Countries: India (413.85 million), United States (171.7 million), Brazil (140.7 million).
- User Interaction: Instagram Reels accounts for over 50% of user time spent on the platform.
-
TikTok

TikTok Homepage - Active Users: Tiktok has over 1.5 billion monthly active users.
- Gender Distribution: Approximately 55.7% female and 44.3% male globally.
- Top Countries: United States (135 M+ users), Indonesia (107.7 M) and Brazil (91.7 M).
- User Interaction: Nearly 7 in 10 users report discovering products on TikTok that they ultimately purchase.
-
X (Formerly Twitter)

X Homepage - Active Users: X has approximately 611 million monthly active users
- Gender Distribution: Globally, 68.6% male and 31.34% female.
- Top Countries: The United States leads with 106.23 million users.
- User Interaction: Users spend an average of 30.9 minutes daily on X, with a 12.5% year-over-year increase in time spent
-
LinkedIn

LinkedIn Homepage - Active Users: Linkedin hosts around 1 billion users globally.
- Gender Distribution: Globally, 55% male and 45% female.
- Top Countries: United States (239M), India (155M), Brazil (86M).
- User Interaction: 82% of B2B marketers report that LinkedIn has been the most effective platform for achieving their marketing goals.
-
Pinterest

Pinterest Feed - Active Users: Pinterest has approximately 570 million monthly active users.
- Gender Distribution: Globally, 70% female and 22.6% male.
- Top Countries: United States (95.6M), Brazil (40.4M), Mexico (26M).
- User Interaction: 80% of people who use Pinterest each week say they find its shopping experience inspiring.
Social Media and Mental Health Statistics
Social media’s influence on mental health is a growing concern worldwide. Research indicates that nearly 40% of active social media users in the US exhibit signs of addictive behaviors.
Social Media Addiction Statistics
Approximately 210 million people worldwide are affected by social media and internet addiction, with young adults aged 18 to 22 exhibiting the highest addiction rates, often spending up to 7 hours daily on these platforms.
This excessive use is associated with various mental health issues, including depression, anxiety, low self-esteem, and feelings of isolation. Moreover, 56% of social media users report experiencing FOMO (Fear of Missing Out), which can exacerbate feelings of inadequacy and contribute to addictive behaviors.
Yet, it is important to recognize the dual role of social media. While addiction poses significant risks, social media and mental health statistics also highlight its potential as a platform for positive engagement.
According to a 2023 global survey by Statista, 32% of social media users follow therapists and mental health professionals for mental health content.
Featured Article: Facebook Ads for Real Estate: Proven Strategies, Success Stories, and Expert Tips for 2025
Turning Social Media Statistics Into Strategy (With Social Champ)
Data is only valuable when it shapes decisions.
The social media marketing statistics you’ve seen on user behavior, platform trends, content engagement, and audience demographics are just reflective of where users are.
They point to where your strategy should go next.
That’s where a clear framework, supported by the right toolset, can transform insight into action.
Let’s explore how to turn social media numbers into smarter, more informed execution—step by step.
-
Time Your Posts Based on Behavioral Peaks
Posting schedules should be shaped by when your audience is most likely to engage not just by conventional wisdom or convenience.
For instance, if younger demographics are spending more than three hours daily on social media, but their activity clusters around evening hours, that’s when your content should appear.
Social Champ helps map this window by tracking when your posts get the highest interaction and suggesting optimal posting times across platforms.
-
Match Content Formats With What Users Actually Engage With
Data clearly points to a shift in how users interact with content.
Short-form videos may outperform images in terms of watch time or shares, but that doesn’t mean they’re right for every audience or every message.
Social media stats help identify what your audience prefers, whether it’s swipeable carousels, reels, long captions, or minimal text.
Social Champ’s multi-format publishing lets you test and refine what works best, then scale the formats driving engagement.
-
Be Region and Country-Aware
User growth isn’t evenly distributed. Some countries are seeing explosive growth in daily active users, while others are stabilizing.
Tailoring your strategy by country rather than generalizing by region allows for sharper targeting.
Whether you’re launching a paid campaign or planning organic growth, grounding your decisions in real-time usage patterns helps avoid wasted reach.
Social Champ offers time zone adjustment features, allowing you to manage multiple profiles across countries without losing strategic focus.
-
Let Your Data Guide What’s Next
Track patterns in your top-performing posts. Are certain content types trending up? Is engagement dropping on particular days or formats?
These patterns help you course-correct before campaigns lose momentum.
Social Champ’s powerful analytics brings these performance signals into one place, so you can compare, contrast, and adjust without switching between platforms.
-
Build a Strategy That Evolves With the Metrics
Social media is in constant motion. What works in Q1 might underperform in Q3. Your strategy should never be static.
Set benchmarks based on current stats engagement rates, reach, click-throughs and revisit them monthly.
Use these as live signals to refine your voice, adjust your cadence, and rethink your visual direction.
-
Streamline Execution With Smarter Tools
You don’t need to do this manually. A platform like Social Champ doesn’t replace your strategy, it helps you operationalize it.
From publishing automation and content calendar planning to performance tracking and cross-platform reporting, it keeps the process organized and efficient so you can focus on shaping content that drives results.
Want to Save Time and Boost Engagement?
Let Social Champ help you manage multiple accounts effortlessly while maximizing your reach with data-driven insights.
What These Social Media Stats Tell Us About Future Trends
From the rise of AI to the dominance of short-form content and shifts in monetization models, the landscape is evolving quickly.
These changes are creating new opportunities for marketers who are ready to adapt.
-
AI Is Changing the Way Content Gets Made
As the demand for content continues to grow, brands and creators are turning to AI to streamline production.
AI is already helping with tasks like generating captions, writing scripts, designing visuals, and optimizing posting times.
This shift is making content creation faster, more consistent, and more responsive to user behavior.
Moving forward, marketers will need to blend automation with authenticity to stay competitive.
-
Short-Form Video Is Now a Standard Format
Short videos have gone from a trend to a central part of user engagement.
While entertainment remains a strong driver, short-form content is increasingly being used for education, product promotion, and storytelling.
Audiences expect quick and clear value. Marketers should focus on creating short videos that are not just visually appealing but also deliver a strong message within the first few seconds.
-
Social Commerce Is Becoming a Full Experience
Buying through social platforms is no longer a side feature. More users are discovering, evaluating, and purchasing products without ever leaving their favorite apps.
Features like live shopping, in-app checkout, and personalized recommendations are shaping a more complete shopping journey.
For marketers, this means rethinking content strategies to include product tutorials, user testimonials, and interactive formats that build trust and drive conversions.
-
Monetization Is Evolving for Both Platforms and Creators
Platforms are finding new ways to keep creators engaged. Subscriptions, bonus programs, and ad revenue sharing are becoming more common.
This shift is encouraging creators to focus on building loyal communities instead of just chasing views.
Marketers will need to collaborate more strategically with creators who can deliver sustained engagement, not just one-time reach.
-
Flexibility Is the Core of Long-Term Strategy
The only constant in social media is change. User behavior, content formats, and platform algorithms continue to shift.
Marketers who use data to refine their approach regularly will stay ahead. A strategy that worked last year may not perform the same way today.
Continuous testing, learning, and adjusting are critical to keeping up with where social media is headed.
Featured Article: The Ultimate SaaS Marketing Strategy for 2025: 15 Proven Tactics to Drive Growth
Conclusion
Understanding the latest social media statistics is key for any brand or marketer in 2025.
With billions of people using platforms like Facebook, Instagram, TikTok, LinkedIn, and Pinterest, knowing who uses them, how they engage, and what works in advertising helps create better strategies.
These stats show where to focus, how to reach the right audience, and how to get the most out of your budget.
By using Social Champ’s scheduling, analytics, and performance tracking features, marketers can make better use of current social media statistics, manage content more efficiently, and adjust their strategies based on real-time data.
With the right insights and the right tools, brands can grow faster and connect more meaningfully with their audience.