I still remember the Friday I sat down with three tabs open, one for Instagram insights, one for a spreadsheet I’d built at 11 PM the night before, and one for a coffee that had gone cold an hour earlier.
I had numbers. Plenty of them. Reach, impressions, likes, a follower count that ticked up by four people that week. What I didn’t have was a clue what to do with any of it.
If you run social media for a living, or even just for your own small business, you probably know that feeling. You’re not short on data. You’re short on direction. And that gap between having numbers and actually knowing what they mean is where most of us lose our Friday afternoons.
So let’s talk about it. Not in a “here’s a listicle of 10 social media metrics you should track” way, because honestly, you’ve read that article a dozen times already. I want to talk about why the numbers alone were never going to save us, and what’s really changing now that AI has entered the picture.
Short Summary
- AI-powered analytics turns raw social media data into clear, actionable insights.
- Tracking more metrics does not always create clarity, especially when vanity metrics distract from real goals.
- AI can spot cross-platform patterns, emerging trends, and meaningful changes faster than manual analysis.
- Insights become more useful when they guide decisions about posting times, content types, audience sentiment, and competitors.
- AI helps reduce the time teams spend digging through reports and gives them more time for strategy.
- Social Champ’s Switch lets users ask questions about performance and get plain language answers instead of static reports.
- The goal of AI-powered analytics is not more numbers, but less guessing and faster, informed action.
Why Raw Numbers Aren’t the Problem, Understanding Them Is
Here’s the thing nobody tells you when you first get access to an analytics dashboard: more data doesn’t automatically mean more clarity. In fact, it usually means the opposite at first.
I used to think the goal was to track everything. Every metric, every platform, every post. But somewhere along the way, I realized I was collecting numbers the way some people collect receipts, just in case I needed them someday.
Meanwhile, the actual question I was supposed to be answering, “Is what I’m doing working?” kept getting buried under spreadsheet tabs.
Vanity Metrics vs. Metrics That Truly Move Things
A follower count going up feels good. I won’t pretend otherwise. But it doesn’t tell you whether those followers are engaging, converting, or even real.
Compare that to something like engagement rate relative to reach, or the percentage of your audience who came back to comment a second time. Those numbers are less flashy, but they tell you something you can act on.
This is where a lot of us get stuck. We know, in theory, which metrics matter more. But knowing that and having the time to dig through platform-by-platform reports every week are two very different things.
That’s the real problem AI ended up solving, not the tracking part, but the translating part.
What Changes When AI Enters the Picture
I’ll be straight with you. When AI-powered analytics tools first started showing up in social media platforms, I was skeptical. I’d tested enough tools that promised the world and delivered a slightly prettier version of the same spreadsheet. So I went in expecting more of the same.
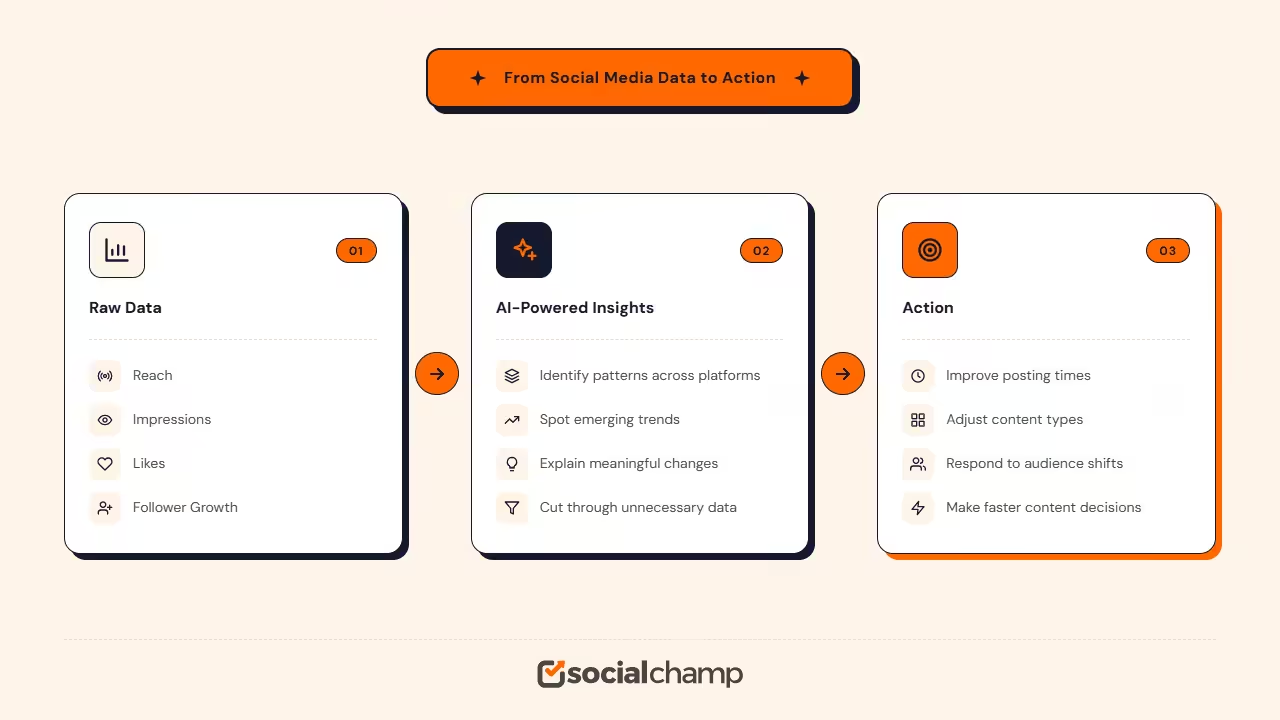
What actually changed my mind wasn’t speed. Sure, AI processes numbers faster than I can open a browser tab. But the bigger shift was in what the tools started telling me, not just what happened, but what it might mean and what tends to happen next.
A few things stood out to me as genuinely useful, rather than just automated for the sake of it:
- Pattern recognition across platforms. Instead of comparing Instagram data in one tab and X data in another, the tool connects the dots and shows me where my audience behaves similarly and where they don’t.
- Trend spotting before it’s obvious. A small dip in engagement that I might not notice until it’s a three-week slide gets flagged early, while there’s still time to adjust.
- Cutting through the noise. Rather than a wall of charts, I get a plain-language summary of what actually shifted and why it likely happened.
None of this replaces judgment. I still have to decide what to do with the information. But it changes the starting point from “let me figure out what happened” to “here’s what happened, now what do we do about it.” That’s a meaningfully different Friday afternoon.
Still Drowning in Social Data?
From Insights to Action, What This Looks Like Day to Day
This is the part that used to be missing for me. Insights are great in theory, but they only matter if they change what I do next. So let me walk you through what a more typical week looks like now compared to before.
The Practical Stuff That Saves Time
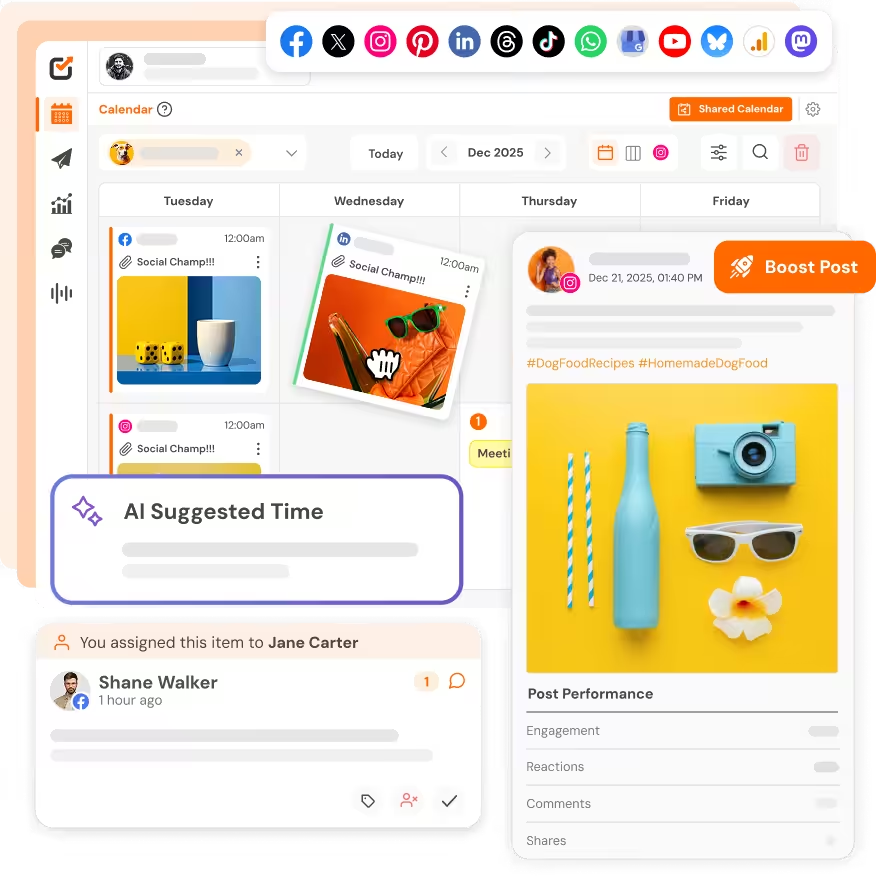
- Best time to post, based on my real audience. Not a generic “post at 9 AM” tip pulled from a blog written for a different industry, but timing built from how my specific audience has behaved recently.
- Content type recommendations. If carousel posts have been quietly outperforming static images for three weeks, I want to know that before I plan next month’s content, not after.
- Audience sentiment shifts. Comments and replies carry tone, and noticing a shift from positive to lukewarm early gives me a chance to adjust messaging before it becomes a pattern.
- Competitor benchmarking. Not to copy anyone, but to know whether a dip in my numbers is about me, or if the whole industry saw the same thing that week.
Honestly, the biggest change is that I spend less time hunting for the story in the data and more time deciding what to do about the story once I’ve got it.
That’s an hour or two back in my week, sometimes more, and if you’ve ever tried to carve out strategy time during a busy content sprint, you know how rare that hour actually is.
The Cost of Sticking With the Old Way
I’ll say this gently, because I’ve been there myself. Brands that are still manually exporting spreadsheets and eyeballing trends line by line aren’t doing anything wrong, exactly. But they are working with a delay that faster-moving competitors don’t have anymore.
By the time a manual review catches a shift in what’s working, a team using AI-assisted analytics has often already adjusted their content plan and moved on.
That’s not meant to create panic. It’s just worth being honest about. The teams making faster, more confident calls are usually the ones who’ve stopped treating analytics as a monthly report and started treating it as an ongoing conversation.
A Quick Word on Switch
Speaking of turning analytics into a conversation, I want to mention something we’ve been building at Social Champ, since it’s directly related to everything I just walked through.
Social Champ recently launched Switch, our AI Assistant, and one of the things I appreciate most about it is that it doesn’t just hand you a report and leave you to interpret it alone.
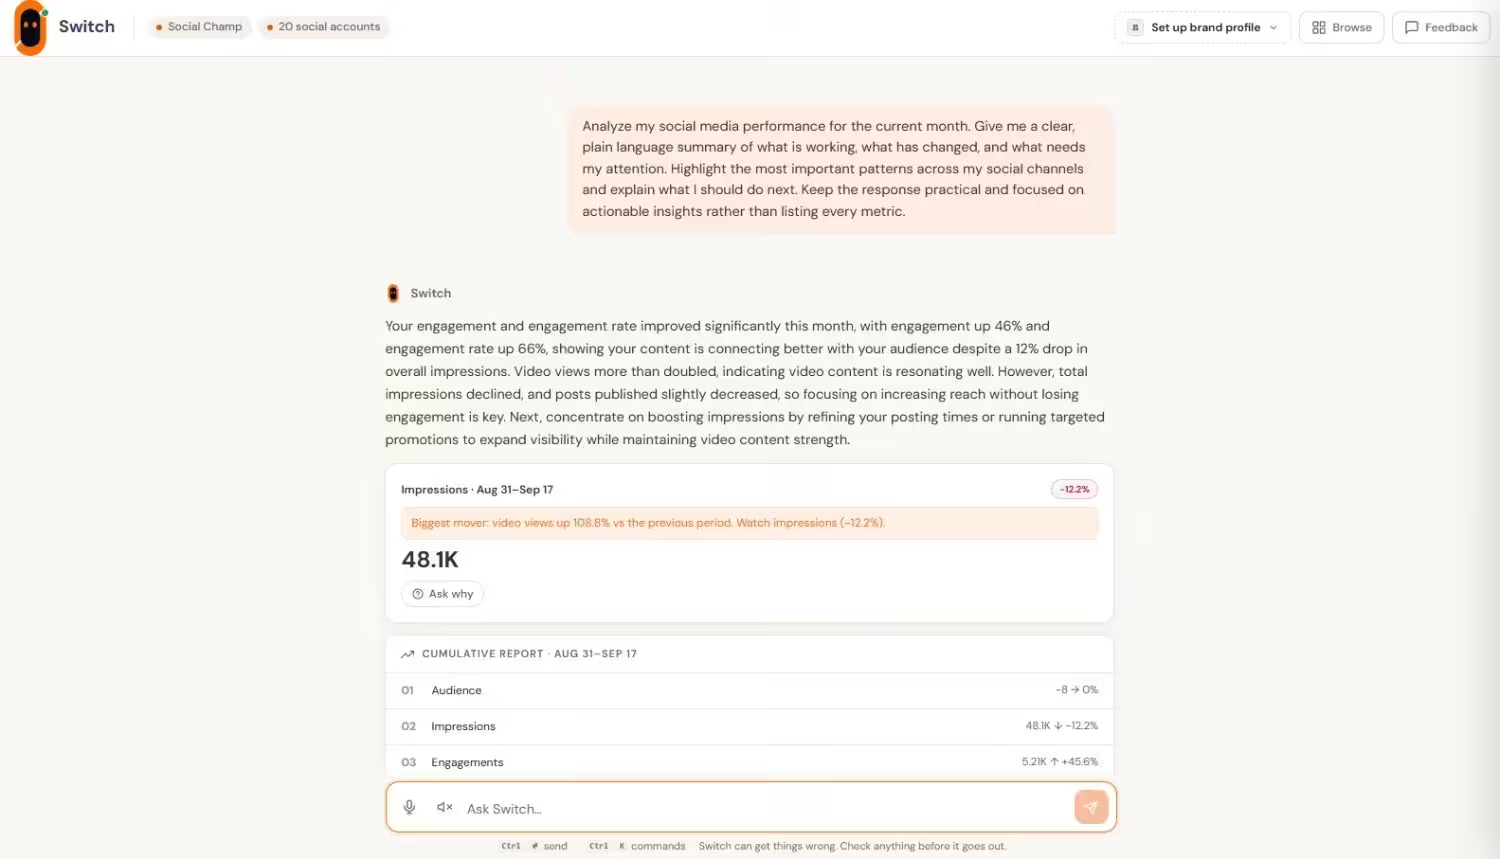
You can ask Switch a direct question, something like what’s working this month or where engagement dropped, and get an answer in plain language instead of a chart you have to squint at.
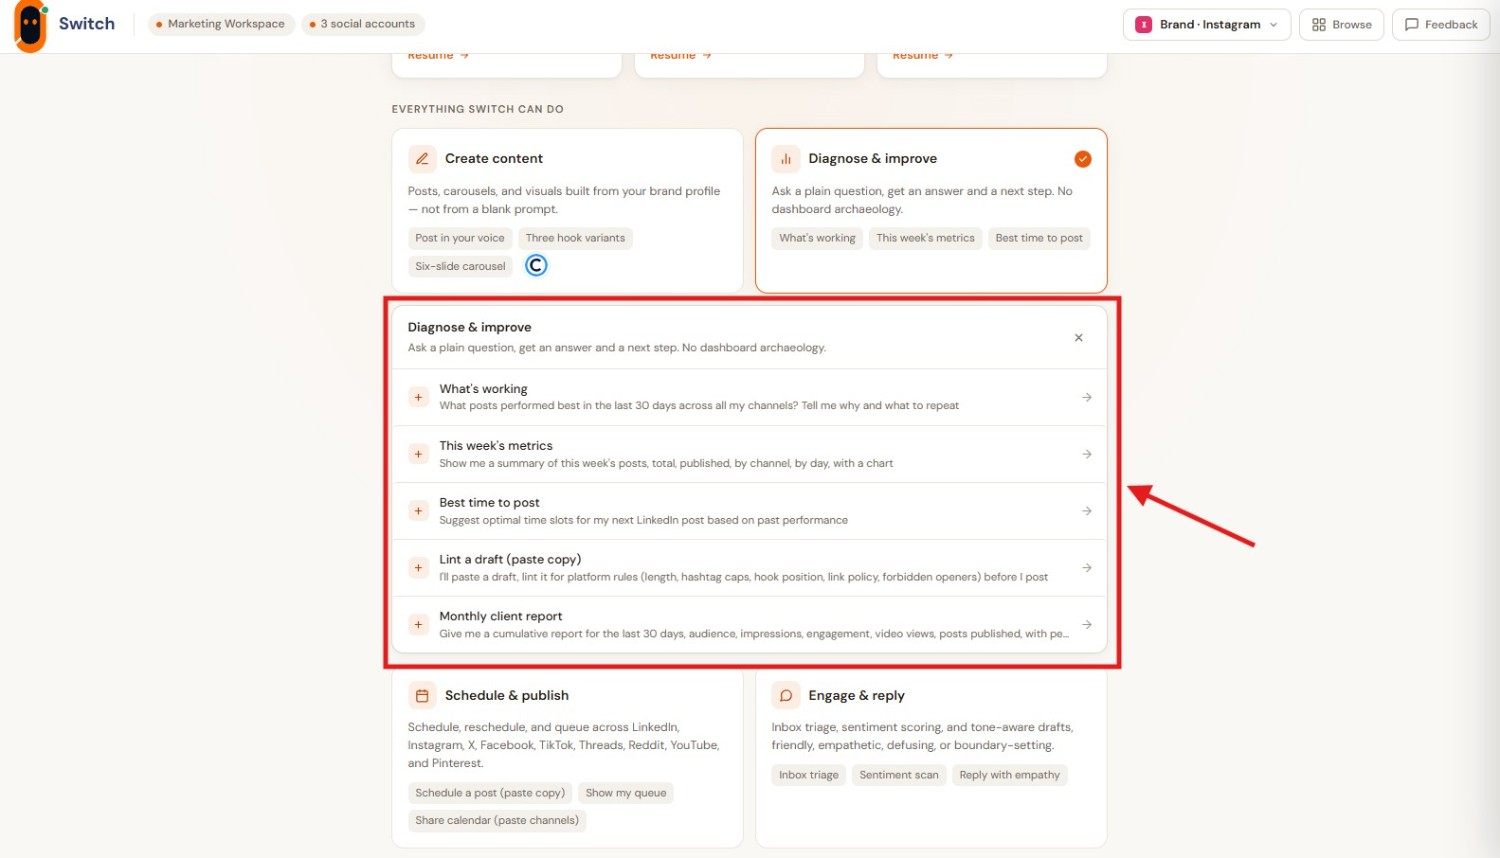
Its Diagnose & Improve module is built around that idea: ask a plain question, get an answer and a next step. It reads your workspace analytics and comes back with a recommendation, not just the numbers. Each option below drops a ready-made prompt into the chat, so you can tweak it before sending.
What’s Working
This is the question I used to spend whole Friday afternoons trying to answer. Ask Switch what’s working, and it looks at your recent performance to point out which posts and content types are pulling their weight, along with what you might do more of.
This Week’s Metrics
You can say it’s a quick snapshot of how the week went, without opening a single dashboard. It’s a handy way to keep that weekly review habit I mentioned later in this article, without it turning into a chore.
Best Time to Post
Instead of a generic posting schedule, Switch looks at when your own audience has been most active. That makes it much easier to plan around real behavior rather than a tip written for someone else’s industry.
Lint a Draft
Paste in a post you’re working on and get a second look before it goes out. It’s a useful way to catch issues early, so your analytics insights actually shape what you publish next.
Monthly Client Report
If you manage social media for clients, this one saves real time. Rather than pulling numbers into a report by hand, you can ask Switch to put together a monthly summary of how things performed.
Switch also fits into how teams already work rather than asking them to learn a new screen. Depending on the task, it can draft something for your review, queue it up for approval, or handle certain eligible actions within limits you control.
The point is to cut down the time between noticing something in your data and acting on it, which, if you’ve read this far, is exactly the gap we’ve been talking about this whole time.
I won’t oversell it here. If you’re curious, it’s worth trying with your own data rather than taking my word for it.
Where to Start If You’re Overwhelmed
If all of this sounds great in theory but you’re not sure where to begin, I get it. Analytics can feel like a lot, especially if you’re managing several platforms at once.
Let me walk you through what helped me simplify things.
- Pick two or three metrics that map to your real goals. Not every metric matters for every brand. First, figure out what success looks like for you.
- Set a weekly review habit instead of a daily one. Checking numbers every single day tends to create noise, not clarity. Weekly patterns tell you more than daily blips.
- Let AI flag anomalies instead of hunting for them yourself. This alone frees up a surprising amount of mental space.
None of this requires becoming a data analyst overnight. It just requires shifting from collecting numbers to using them, and letting the right tools handle the heavy lifting in between.
Featured Article: Best Time to Post on Social Media (Backed by Real Engagement Data)
Conclusion
At the end of the day, analytics were never supposed to be a chore you do after the real work is finished. They’re part of the work itself, the piece that tells you whether everything else you’re doing is actually landing with real people.
Once that shift clicks, you stop treating your dashboard like a monthly obligation and start treating it like a running conversation with your audience. That’s the whole point of pairing AI with your analytics: not more numbers, but less guessing.
And honestly, once the guessing stops, the Friday afternoon spreadsheet spiral becomes a lot less common. The coffee stays warmer too.